From Seed to Series C: What the Data Really Says About Startup Growth
Most startup growth advice relies on anecdotes and outlier success stories. Founders wonder: “Is my 50% year-over-year growth good enough?” Investors ask: “Should I expect 3x returns at Series B?” Without reliable benchmarks, these questions go unanswered.
At Eqvista, we’ve seen how this data gap creates confusion at every funding stage. Last year, we addressed part of this problem with our 409A Valuation Index, helping founders and investors understand how valuations shift from seed to late stage. Now, we’re resolving the other critical question: What does “normal” revenue growth actually look like at each funding round?
This analysis examines revenue growth data from U.S. startups across Seed, Series A, Series B, and Series C stages between 2016 and 2024. Our goal is simple: provide founders and investors with data-driven benchmarks that reveal what growth really looks like—not just for the unicorns, but across the entire spectrum of outcomes.

Key Takeaways on Startup Growth Trends
- Approximately 20% of funded companies experience negative revenue growth.
- Among the companies that continued making revenue, the minimum CAGRs reached -39%.
- Startup revenue growth is categorized by early-stage acceleration and a slowdown as they reach maturity.
- Revenue growth is a high-stakes game where winners deliver exponential returns while losers languish.
- Later-stage startups can deliver market-beating returns, but the potential for exceptional returns is low, possibly because of high base revenues.
How We Analyzed Startup Growth Data (And why Average Lie)
We collected revenue growth data from startups at Seed, Series A, Series B, and Series C stages over the 2016–2024 period. Early in our analysis, we identified a critical problem: averages and medians alone can obscure the full picture, especially when a few extreme outliers skew the results.
Our solution was percentile analysis. Think of it this way: For example, if a startup’s revenue growth falls in the 90th percentile, it outperformed 90% of startups in the dataset. A startup in the 50th percentile grew faster than half of the sample. This point is also referred to as the median. Examining percentile distributions enables more accurate benchmarking and provides a clearer view of the range of startup growth outcomes.
The Reality of Startup Growth: Beyond the Headlines
Our data suggests that, between 2016 and 2024, the average startup’s revenue grew at an astounding CAGR of 136.07%. In this period, the Series B startups outpaced every other category, with revenues growing at an average CAGR of 176.94%. However, this category comes second last when we focus on the median CAGR, while seed-stage startups led the pack.
Revenue growth achieved by US startups between 2016 and 2024
| Funding round | Average | Median |
|---|---|---|
| Seed | 170.91% | 68.45% |
| Series A | 101.54% | 50.32% |
| Series B | 176.94% | 32.59% |
| Series C | 85.29% | 26.38% |
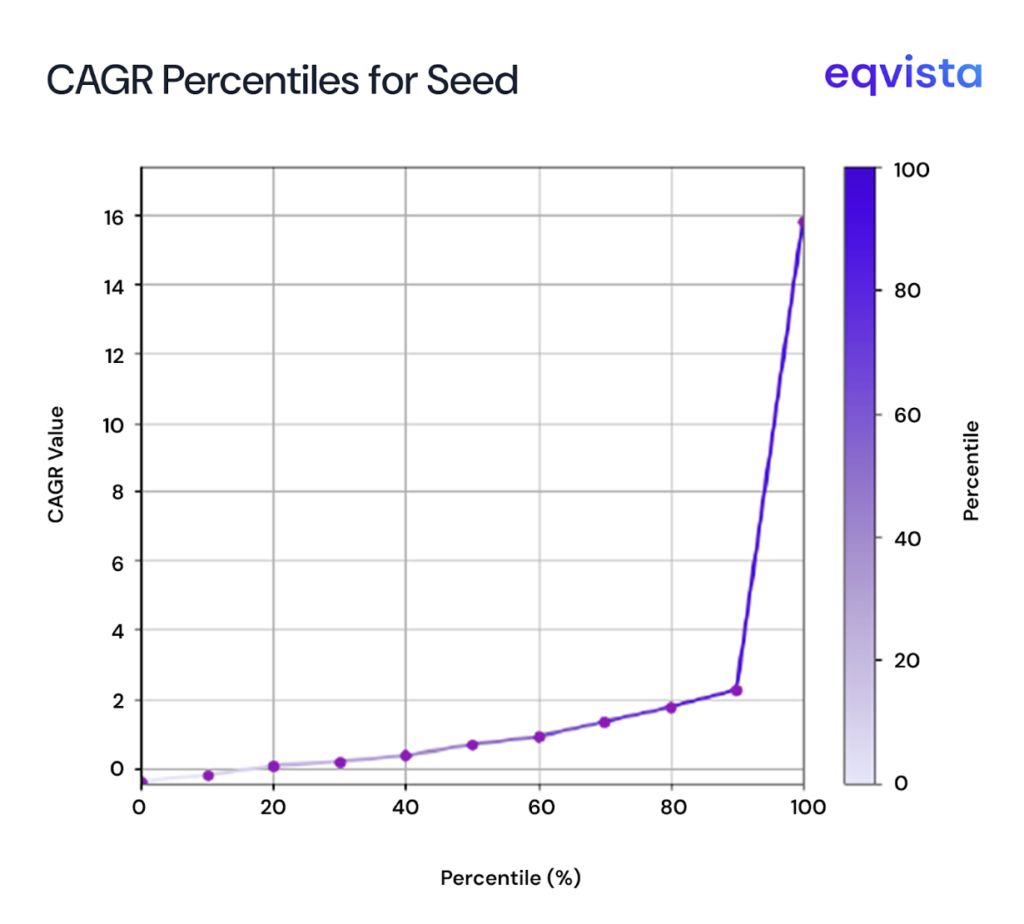
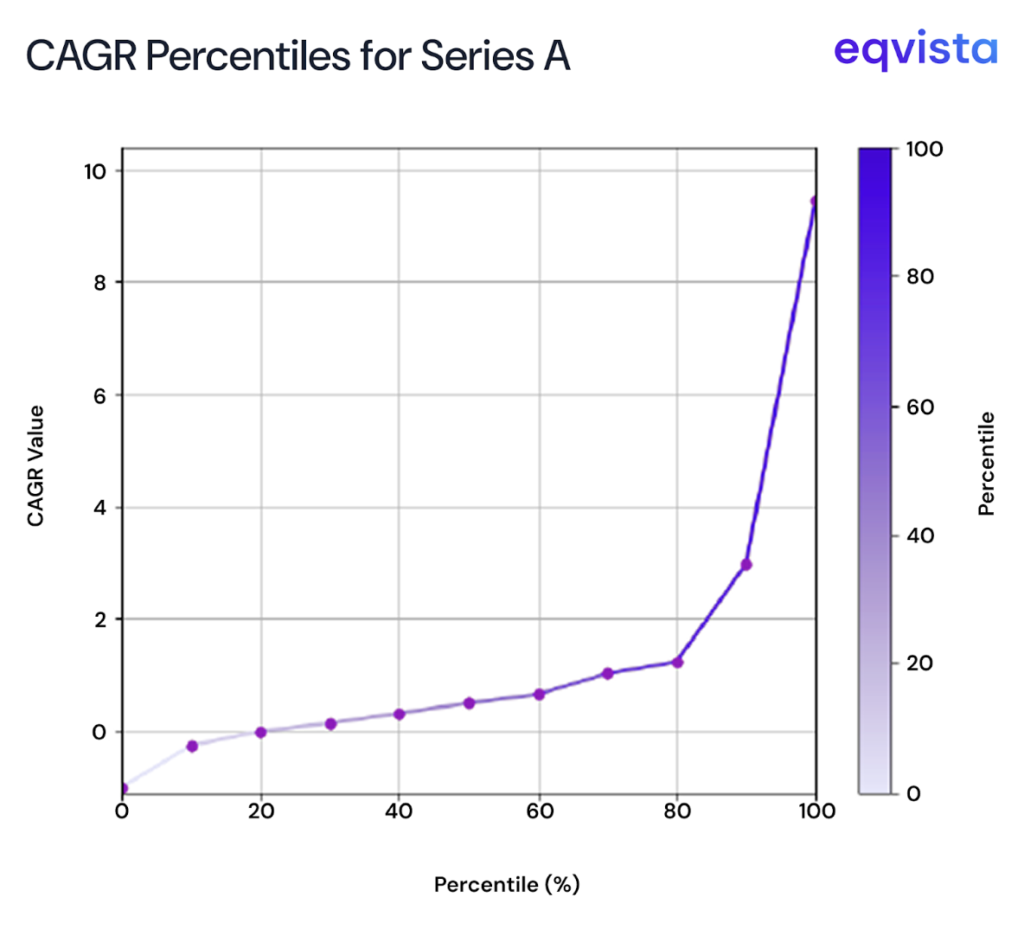
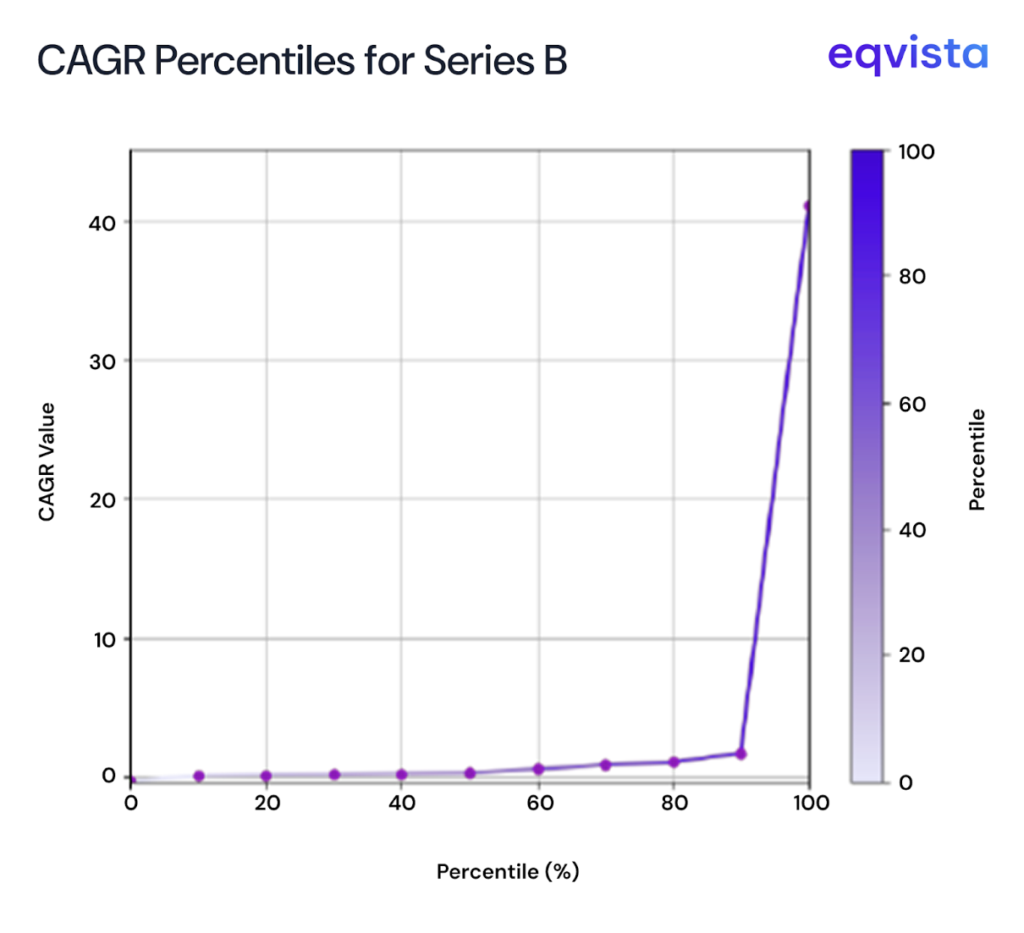
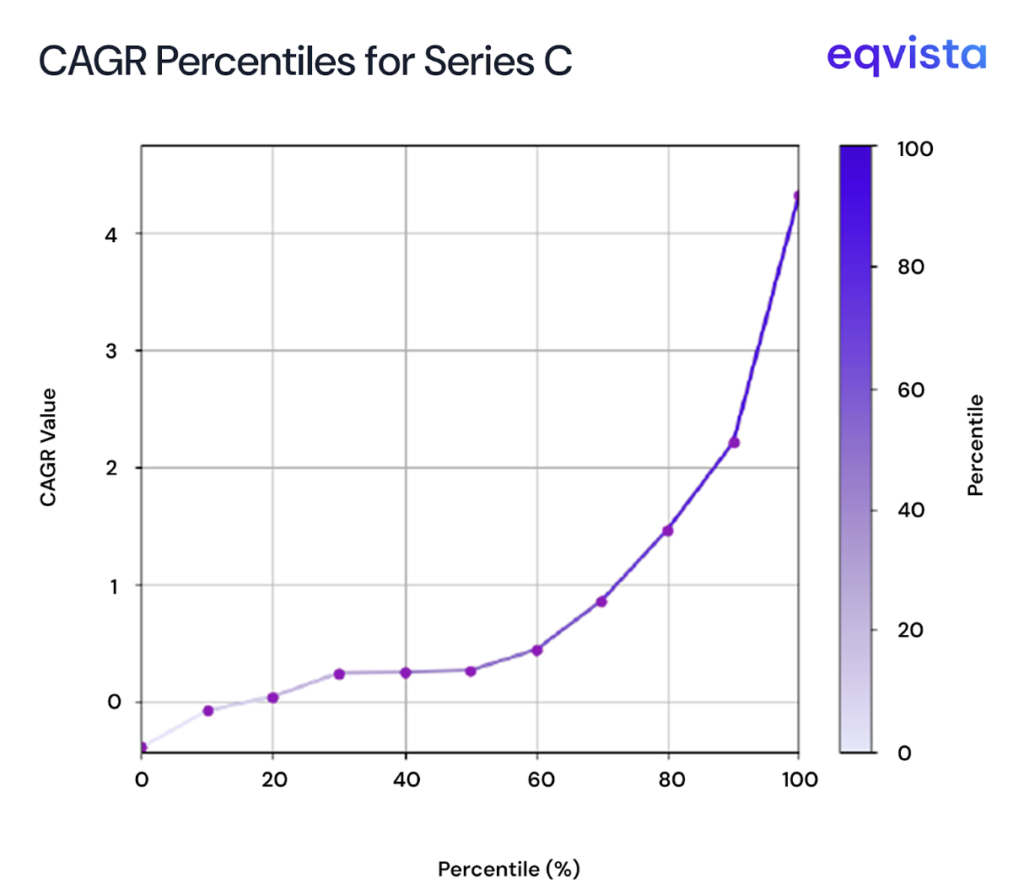
The wide disparity in means and medians points to extremely high outliers. These suspicions are confirmed when looking at the percentile distributions of startup revenue CAGRs. Compared to the 100th percentile values, even the 60th percentile values look like blips on the radar.
Growth Reality: Revenue growth achieved by US startups between 2016 and 2024 – Percentile distribution
| Funding round | Percentile | ||||||||||
|---|---|---|---|---|---|---|---|---|---|---|---|
| 0 | 10 | 20 | 30 | 40 | 50 | 60 | 70 | 80 | 90 | 100 | |
| Seed | -38.80% | -19.98% | 7.37% | 18.95% | 36.16% | 68.45% | 91.47% | 134.25% | 176.19% | 227.41% | 1581.92% |
| Series A | -100.00% | -25.50% | -0.18% | 14.44% | 31.85% | 50.32% | 65.62% | 102.46% | 123.38% | 298.24% | 946.40% |
| Series B | -30.47% | 12.27% | 17.68% | 19.88% | 27.09% | 32.59% | 57.86% | 87.59% | 107.31% | 174.51% | 4106.20% |
| Series C | -39.49% | -8.13% | 3.92% | 23.95% | 24.95% | 26.38% | 43.79% | 85.76% | 146.42% | 220.80% | 432.02% |
Startup Growth by Stage: Balancing Risk and Reward
Let us explore the percentile distribution for CAGRs across each stage.
Seed stage: Extreme Upside, Extreme Risk
The seed stage carries the greatest risk, with extremely high variance in outcomes. Up to the 20th percentile, startups failed to deliver even double-digit CAGR. Yet, by the 60th percentile, revenue nearly doubled every year, and the CAGRs for the very best performers (100th percentile) exceeded 1,500%. This stage shows that extraordinary growth potential exists only alongside the highest failure rates.
Revenue growth achieved by US Seed Stage startups between 2016 and 2024
| Percentile | 0 | 20 | 40 | 60 | 80 | 100 |
|---|---|---|---|---|---|---|
| Revenue growth | -38.80% | 7.37% | 36.16% | 91.47% | 176.19% | 1581.92% |

Series A: Where Half Of Startups Still Lose Money?
Series A startups showed significant downside risk, with negative returns up to the 20th percentile. However, from the 40th percentile onward, returns began to align with typical VC expectations. Beyond this point, CAGRs roughly doubled every 20 percentile points until a dramatic peak was achieved at the 100th percentile. This illustrates both the volatility and the high potential rewards at this stage.
Revenue growth achieved by US Series A startups between 2016 and 2024
| Percentile | 0 | 20 | 40 | 60 | 80 | 100 |
|---|---|---|---|---|---|---|
| Revenue growth | -100.00% | -0.18% | 31.85% | 65.62% | 123.38% | 946.40% |

Series B: The most unpredictable stage in Venture Capital
For more risk-conscious investors, Series B offers a better balance between risk and return. Even at the 20th percentile, startups delivered market-beating CAGRs. Growth trajectories still showed stepwise doubling every 20 percentile points. But, if we ignore the 100th percentile outlier, Series B had lower returns than the Seed and Series A categories.
Such a distribution likely reflects the dual effect of high baseline revenues, while the realization of scaling opportunities enables disproportionate growth at the upper end of the spectrum.
Revenue growth achieved by US Series B startups between 2016 and 2024
| Percentile | 0 | 20 | 40 | 60 | 80 | 100 |
|---|---|---|---|---|---|---|
| Revenue growth | -30.47% | 17.68% | 27.09% | 57.86% | 107.31% | 4106.20% |

Series C: Steady Growth
Series C outcomes appear more normalized, with fewer dramatic outliers. Except at the 80th percentile, CAGRs were modest compared to earlier stages. The reduced variance signals lower risk exposure but also limits the possibility of exceptional returns.
Revenue growth achieved by US Series C startups between 2016 and 2024
| Percentile | 0 | 20 | 40 | 60 | 80 | 100 |
|---|---|---|---|---|---|---|
| Revenue growth | -39.49% | 3.92% | 24.95% | 43.79% | 146.42% | 432.02% |

Why VC Returns Depend on just 10% of portfolio companies
The average CAGR is roughly 2x the median across stages, except in Series B, where the average is 443% higher than the median. This underscores the pull of extreme winners on overall growth rates.
Let us explore the statistical significance of this data.
How Skewed Is Startup Growth Data?
The data shows a consistent positive skew across early and mid-stages, meaning a small number of companies deliver disproportionately high returns while most underperform.
US startup revenue CAGR – Skewness across stages
| Funding round | Kelly’s Skewness Measure |
|---|---|
| Seed | 0.29 |
| Series A | 0.53 |
| Series B | 0.75 |
| Series C | 0.7 |
- Seed and Series A categories have positively skewed distributions, reflecting the presence of a few breakout companies while the majority struggle or fail.
- The Series B category has the highest degree of skewness, marking this stage as the most unpredictable, where the gap between winners and losers is widest.
- Skewness falls in the Series C category, with outcomes more evenly distributed, suggesting more predictable and moderate growth trajectories compared to Series B.
The Role of Outliers: Analyzing Startup Kurtosis
Kurtosis describes the significance of the peaks in a given dataset. A normal distribution has a kurtosis of 3, and anything beyond this point is called excess kurtosis. In our data, only Series C had a low excess kurtosis of 0.74. Seed, Series A, and Series B categories had extremely high kurtosis of 10.08, 7.61, and 10.94, respectively.
US startup revenue CAGR – Kurtosis across stages
| Funding round | Kurtosis |
|---|---|
| Seed | 10.08 |
| Series A | 7.61 |
| Series B | 10.94 |
| Series C | 3.74 |
Key risk-reward takeaways for each stage
The following table summarizes the risk-reward profile of startups from each stage:
| Stage | Risk level | Reward potential | Type of investment opportunity |
|---|---|---|---|
| Seed | Very high | Extreme | |
| Series A | High | Solid, with fewer extremes | |
| Series B | Highest | Extreme | |
| Series C | Moderate | Moderate |
Data Caveats in Analyzing Startup Growth
While the results of this report are consistent with conventional VC wisdom, there is a possibility of small sample sizes magnifying the impact of extreme values. Also, external factors greatly influence a startup’s fortune. Hence, negative growth rates may reflect broader economic slowdowns and company-specific issues to a certain extent.
Lessons for Startup Investors and Founders
Based on the findings of this report, investors can manage the overall risk-return profile of a VC portfolio in the following manner:
- Treat Seed and Series B as speculative bets. Their high skewness and kurtosis make them prone to extreme outcomes. These investments can be both spectacular winners and significant losses. Limit exposure in volatile markets to avoid outsized downside.
- Lean on Series A and Series C for balance. With comparatively lower variance, they can stabilize portfolio risk. While average return potential may look modest, strong performers in these rounds can still deliver meaningful upside.
- Think in terms of power laws. Most investments will not move the needle, but the outliers will drive portfolio returns, especially in Seed and Series B.
On the other hand, startup founders can interpret the results of this report in the following manner:
- The percentile distributions across sectors are proof that growth is not always linear.
- Don’t benchmark against averages. Growth rates compound dramatically at higher percentiles.
- Series B is the pivotal stage. It’s the make-or-break moment to outpace competitors, achievable only if traction is built steadily through Seed and Series A.
- Progress compounds in revenue terms. Each milestone doesn’t just add value; it unlocks disproportionate jumps in revenue.
Eqvista- Your Partner in Navigating Growth, Risk, and Valuation in Startups!
Limited data can be more dangerous than no data at all. To truly understand valuation dynamics in venture capital, it is essential to examine each data point from multiple angles and uncover the underlying patterns.
If you’re looking to gain a deeper understanding of your startup’s or portfolio company’s valuation, reach out to Eqvista for comprehensive, data-backed valuation services that turn insights into action. Contact us here!
