3 Company Valuation Methods: Asset, Income and Market
There are a lot of methods used today to find the value of your company.

You built a business. But do you actually know what it is worth? Most business owners can name their revenue and margins, but when an investor asks “What is your company worth and how did you get there?” Most founders go quiet. That gap is expensive. In 2025, global M&A deal value rose 40% to $4.9 trillion, the strongest year since 2021, while the global business valuation service market reached $8.03 billion and is projected to grow to $11.75 billion by 2030 at 7.8% CAGR. Professional valuation is now a baseline requirement, not a premium add-on.
Valuation is not a single formula. There are dozens of methods, each built for a different type of business, stage, and purpose. Pick the wrong one and you either overprice your company or undervalue it. It is also important to recognise that general business valuation, M&A valuation, fundraising valuation, and 409A valuation are not the same thing. Each has a different audience, a different standard, and a different method.
Professional valuations are generally organized around three broad approaches: the Asset-Based Approach, Income Approach, and Market Approach. Specific methods within each approach can vary based on the business, purpose, and available data.
Key Takeaways
- Global M&A 2025: Total deal-making activity surged nearly 40% to a record $4.9 trillion in 2025 the strongest year since 2021. Understanding valuation methods is now non-negotiable for any founder, investor, or M&A participant.
- Valuation market: $8.03 billion in 2025, projected to reach $11.75 billion by 2030 at 7.8% CAGR driven by M&A activity, regulatory compliance (IFRS 13, ASC 820), and private equity expansion.
- Three main methods: Asset Based, Earnings (DCF/Cap Rate), and Market Value (Comps). Each one answers a different question . Each has a suitable business of its own.
- Software M&A multiples (H2 2025): Median 3.1x EV/Revenue and 26.1x EV/EBITDA up significantly from prior years as operating leverage and earnings visibility improve.
- Best practice: Professional valuators triangulate across two or three methods. Convergence produces a defensible number.
What Are the Three Main Company Valuation Methods?
The three main company valuation approaches are the Asset-Based Approach, Income Approach, and Market Approach. The asset approach focuses on assets and liabilities, the income approach focuses on future earnings or cash flows, and the market approach uses comparable companies or transactions.

There are three foundational approaches to valuing a company. The Asset-Based Approach examines what a business owns and owes. The Income / Earnings Approach projects what it will earn. The Market Approach compares it to similar businesses. Each one is designed to answer a different question, and each is suited to a different type of company, stage, and valuation purpose.
| Asset-Based | Earnings (DCF) | Market Value | |
|---|---|---|---|
| Core Question | What do we own minus what we owe? | What will we earn in the future? | What would a buyer pay today? |
| Best For | Asset-heavy, distressed, holding companies | Stable, profitable, or growth-stage companies | Companies with comparable public or M&A data |
| Key Metric | Net Asset Value (NAV) | Free Cash Flows + WACC | EV/EBITDA, EV/Revenue, P/E |
| Data Needed | Balance sheet + appraisals | Projections + discount rate | Comparable company transactions |
| Limitation | Ignores future earnings | Sensitive to assumptions | Requires true comparable data |
Method 1: The Asset-Based Approach: When should you use it?
The Asset-Based Approach values a company by calculating what it owns and subtracting what it owes. It is the most straightforward of the three methods and the most commonly misapplied. Raw book value almost always understates a company’s true worth because the balance sheet records assets at historical cost, not current market value.
How to Calculate Net Asset Value
Net Asset Value (NAV) = Total Assets − Total Liabilities
The Adjusted Net Asset Method (ANAM) fixes the raw-book-value problem by revaluing every asset tangible and intangible at its current fair market value before deducting liabilities. This includes recognizing internally developed IP, brand value, customer relationships, and other intangibles that never appear on a standard balance sheet.
When Should You Use the Asset Approach?
- Asset-heavy industries: manufacturing, mining, real estate, logistics, utilities
- Companies generating recurring losses or operating below breakeven
- Businesses facing liquidation, distress, or bankruptcy
- Holding companies whose primary assets are investments or real estate
- M&A due diligence where verifying tangible assets is critical to the deal structure
Step-by-Step Process
- Step 1 – Inventory all tangible assets – List real estate, equipment, vehicles, cash, inventory, and receivables at current market value not the cost recorded on the books.
- Step 2 – Identify intangible assets – Patents, trademarks, proprietary software, customer contracts, and brand goodwill. These often do not appear on the balance sheet but can represent the majority of a company’s true value.
- Step 3 – Revalue everything to FMV – Engage appraisers or use recent market data to replace historical cost with current fair market value for each asset class.
- Step 4 – Deduct all liabilities – Include current liabilities, long-term debt, deferred taxes, and any contingent liabilities (pending lawsuits, warranty obligations).
- Step 5 – Calculate Adjusted NAV – The resulting figure is your company’s value on an asset basis. In M&A negotiations, this figure is often used as a reference point for the asset component of a deal, though it is not automatically treated as a floor.
Example: SolarPath Manufacturing
SolarPath is a mid-sized solar panel manufacturer being evaluated for acquisition. Its raw balance sheet shows $2.42M in net assets but after revaluing equipment at replacement cost, recognizing a land appreciation, and adding unrecorded IP, the adjusted picture looks very different:
| Balance Sheet Item | Book Value ($) | Adjusted Market Value ($) |
|---|---|---|
| ASSETS | ||
| Cash & Equivalents | 420,000 | 420,000 |
| Accounts Receivable | 310,000 | 310,000 |
| Inventory (raw materials) | 560,000 | 490,000 |
| Manufacturing Equipment | 1,200,000 | 1,650,000 |
| Land & Building | 800,000 | 1,100,000 |
| Proprietary Solar Technology (IP) – not on balance sheet | — | 380,000 |
| Total Assets | 3,290,000 | 4,350,000 |
| LIABILITIES | ||
| Accounts Payable | 180,000 | 180,000 |
| Long-term Debt | 600,000 | 600,000 |
| Deferred Tax Liability | 90,000 | 90,000 |
| Total Liabilities | 870,000 | 870,000 |
| NET ASSET VALUE (NAV) | 2,420,000 | 3,480,000 |
Result: Raw NAV = $2.42M. Adjusted NAV = $3.48 million – a 44% uplift simply by using current market values instead of historical cost. This is why ANAM must always replace raw book value in professional valuations.
Method 2: The Earnings Approach (DCF & Capitalization of Earnings): How to value Future Cash Flows?
The Earnings Approach rests on one key idea: a company is worth the present value of all the cash it will create in the future. Preferred for profitable businesses, SaaS companies, and growth-stage startups with credible projections.
Form 1 – Discounted Cash Flow (DCF)
Projects free cash flows over a defined forecast period commonly 5 to 10 years in practice, though the appropriate length depends on the business type, industry, and when cash flows are expected to stabilize and discounts them to today’s dollars using the Weighted Average Cost of Capital (WACC). According to Hustle Fund’s DCF guide for startups, a DCF is most useful as an “assumption audit”; it forces founders to expose what must go right.
DCF = CF₁/(1+r)¹ + CF₂/(1+r)² + … + CFₙ/(1+r)ⁿ + Terminal Value
Form 2: Capitalization of Earnings
A simpler variant suited to stable, mature businesses with predictable, near-constant earnings. Rather than projecting multiple years of cash flows, it assumes earnings continue at a steady rate indefinitely:
Business Value = Annual Normalized Earnings ÷ Capitalization Rate
Capitalization rates for small businesses typically range from 20% to 25%, reflecting the return on investment buyers expect. The cap rate is essentially the inverse of a P/E multiple: a 25% cap rate = 4x earnings.
WACC: The Discount Rate That Drives Everything
WACC is the most important and most argued-about input in any DCF. It reflects the blended cost of all capital equity and debt adjusted for risk.
Example: NovaPay Fintech (5-Year DCF)
NovaPay is a B2B payments startup with 3 years of operating history and accelerating revenue. It is raising a Series A. Its investor uses a 25% WACC (reflecting early-stage risk) and a 5% terminal growth rate to project 5 years of free cash flows:
| Year | Free Cash Flow ($) | 25% PV Factor | Present Value ($) |
|---|---|---|---|
| 2025 | 204,256 | 0.8 | 163,405 |
| 2026 | 263,914 | 0.64 | 168,905 |
| 2027 | 433,366 | 0.512 | 221,884 |
| 2028 | 467,455 | 0.4096 | 191,445 |
| 2029 | 512,255 | 0.3277 | 167,866 |
| Terminal Value (CF × 1.05 ÷ 20%) | 2,689,337 | 0.3277 | 881,195 |
| Sum of PV Cash Flows | 1,794,700 | ||
| Add: Cash & Equivalents | #ERROR! | ||
| Less: Total Debt | − 150,000 | ||
| Equity Value | $2,064,700 |
Terminal Value note: Terminal CF = $512,255 × 1.05 = $537,868. Divided by (25% − 5%) = 20% gives $2,689,337, then discounted back to 2025 dollars at 0.3277. This one number accounts for nearly half of total enterprise value – which is why the growth rate assumption is the most hotly debated input in any DCF.
Method 3: The Market Value Approach: How Comparable Companies Are Worth?
The Market Value Approach is the most externally grounded of the three methods. Instead of building from the inside out (assets or earnings), it asks: “What is the market actually paying for companies like mine, right now?”
It answers this by identifying comparable companies – either publicly traded peers or recently acquired businesses – and applying their valuation multiples (like EV/EBITDA or EV/Revenue) to your own financial metrics.
Two Market-Based Valuation Methods
- Comparable Company Analysis (“Comps” / Guideline Public Company Method) – Identifies publicly traded companies in the same industry and size range. Calculates their valuation multiples. Adjusts for differences in size, growth, margins, and risk. Applies the adjusted multiple to your company’s metrics.
- Precedent Transaction Analysis – Uses pricing from recent M&A deals involving similar companies. Particularly relevant for founders preparing for acquisition, since it reflects what strategic and financial buyers actually paid. Control premiums – the premium paid above standalone value in acquisition transactions – vary considerably by deal type, industry, and strategic rationale, and should be assessed on a transaction-specific basis rather than assumed to fall within a standard range.
2025-2026 Valuation Multiples by Sector
The following multiples are drawn from verified, published research covering actual M&A transactions:
| Sector | Median EV/EBITDA | Median EV/Revenue |
|---|---|---|
| Software (SaaS / Enterprise) | 26.1x | 3.1x |
| IT Services & Consulting | 10.2x | 1.3x |
| Hardware & Semiconductors | 11.0x | 1.4x |
| Healthcare IT Platforms | 10-14x | 4-6x |
| Healthcare Services | 11.5x | 3.0x |
| Financial Services | 10.3x | N/A |
| Real Estate / PropTech SaaS | 9.3-10.4x | N/A |
| Energy & Materials | 7.4-8.9x | N/A |
A note on the software figures: the 26.1x EV/EBITDA and 3.1x EV/Revenue are H2 2025 medians from Aventis Advisors covering disclosed M&A transactions. In H2 2025, the median EV/Revenue ticked up to 3.1x, suggesting early signs of normalization in valuation expectations and a more balanced approach to growth and profitability. The EV/EBITDA median increased to 26.1x, broadly consistent with improving operating leverage and earnings visibility. Private SaaS M&A specifically saw the median EV/Revenue rebound to 3.8x across 2025 deals before easing to 3.1x in Q1 2026.
Example: StratoSoft SaaS Platform
StratoSoft is a B2B SaaS company with $4.2M in ARR, growing at 28% year-over-year, with 72% gross margins and approaching EBITDA breakeven. Here is a comparable company analysis to determine its valuation range:
| Company | EV/Revenue | EV/EBITDA | Rev Growth | Gross Margin |
|---|---|---|---|---|
| HubSpot (HUBS) | 5.8x | 40.2x | 20% | 85% |
| Braze (BRZE) | 4.1x | N/M | 26% | 68% |
| Sprinklr (CXM) | 2.1x | 14.5x | 9% | 72% |
| Zuora (ZUO) | 2.4x | 18.7x | 11% | 64% |
| Clearbit (Private) | 4.0x | N/M | 30% | 75% |
| Median | 4.0x | 18.7x | 20% | 72% |
| StratoSoft (Subject) | 28% ↑ | 72% |
StratoSoft’s 28% growth exceeds the median peer set’s 20%. Applying the median EV/Revenue multiple of 4.0x to its $4.2M ARR:
StratoSoft Base Valuation = $4.2M × 4.0x = $16.8 million
Given its above-median growth and on-median margins, an aggressive buyer could justify 4.5x-5.0x, giving a range of $18.9M-$21.0M. This range becomes the starting point for negotiation, not a final price. Actual deal value depends on synergies, earnouts, and strategic fit.
How to Choose the Right Company Valuation Method
The right method depends on what your business looks like today, not what you hope it becomes. Six factors consistently determine which approach fits best.

1. Nature of Business
Start with what your company actually does. Asset-heavy businesses in manufacturing, mining, real estate, and logistics derive most of their value from physical assets, making the Asset-Based Approach the natural starting point.
Subscription and recurring revenue businesses – SaaS, fintech, healthcare tech platforms – are better served by DCF or Market Comps because their value lives in future cash flows and growth trajectory, not the equipment on the floor.
Pre-revenue startups sit in a different category entirely. With no earnings to capitalize and no comparable transactions to anchor a multiple, the Scorecard Method, Berkus Method, or Venture Capital Method are more appropriate entry points.
2. Purpose of Valuation
A 409A valuation must comply with the requirements of Section 409A and applicable IRS regulations. Professional valuation guidance, including AICPA valuation guidance, may also inform the valuation process
Fundraising conversations are almost always anchored in Market Comps because that is how investors benchmark.
M&A transactions benefit from all three methods triangulated against each other. Shareholder disputes and litigation often favour Asset-Based and Income approaches because courts and arbitrators tend to require objective, well-documented methodologies, though the appropriate standard depends on jurisdiction, valuation date, and legal context.
3. Company Stage
A pre-revenue startup has no earnings to capitalise, so asset-based or VC-method frameworks are the starting point. Once a company crosses into early revenue ($0 to $5M ARR), DCF becomes viable but needs wide scenario ranges to account for execution uncertainty.
At the growth stage ($5M+ ARR), DCF combined with Market Comps can provide complementary perspectives on intrinsic value and current market pricing. Mature, profitable businesses can support all three methods simultaneously, which is when triangulation becomes both possible and necessary.
4. Data Availability
Method selection is also shaped by what data you actually have. Without financial projections, the Asset-Based Approach is often the most practical starting point, though it is not the only conceivable methodology in every case.
Reliable multi-year forecasts combined with genuine comparable companies support DCF and Market Comps. When comparables are limited or thin, weight the DCF more heavily and treat the market multiple as a secondary check.
5. Industry Norms
Every industry has a valuation language investors and acquirers expect you to speak. SaaS companies are evaluated on EV/Revenue multiples. Healthcare deals are benchmarked on EV/EBITDA. Real estate and investment holding companies are valued on NAV.
Financial services firms are typically assessed on Price-to-Book. Manufacturing and industrial companies use EV/EBITDA adjusted for capital expenditure intensity. Presenting your valuation in the wrong metric signals to a sophisticated buyer or investor that you do not understand your own market.
6. Professional Requirements
For internal benchmarking and strategic planning, a well-constructed internal valuation is a reasonable starting point. The moment a transaction, legal proceeding, or regulatory requirement enters the picture, that changes.
Complex M&A deals, 409A compliance, and board-level decisions benefit from a certified valuator – specifically a CVA, ASA, or CPA with an ABV credential. The liability exposure from an unsupported valuation in a legal or tax context far outweighs the cost of professional engagement.
Best Practice: Professional valuators triangulate across at least two methods. When results converge, you have a defensible number. When they diverge significantly, that gap is not a problem to paper over – it usually points directly to the most important risk or growth driver in the business.
How Valuation Changes by Purpose
A common source of confusion is treating all valuations as interchangeable. They are not. The purpose of the valuation determines the applicable standard, the preferred methodology, and in some cases the legal requirements.
| Purpose | Preferred Method(s) | Why |
|---|---|---|
| Fundraising | Market Comps + DCF | Investors benchmark your ask against comparable companies. Market Comps set the range; DCF validates intrinsic value. |
| M&A (Buy or Sell Side) | All three – triangulate | Buyers use asset-based for floor, DCF for intrinsic value, comps for market context. All three should converge. |
| 409A / Stock Options | DCF + Market Comps + Asset-Based (as applicable) | For stock options subject to Section 409A, companies generally need to establish the fair market value of the underlying common stock when determining the exercise price. |
| Shareholder Dispute / Litigation | Asset-Based + Income | Courts and arbitrators typically require objective, documented methods. Depends on jurisdiction and legal standard. |
| Strategic Planning | Any method informally | No legal requirement. The goal is to benchmark progress and inform capital allocation decisions. |
| Estate / Gift Tax | Determined by qualified appraiser | Estate and gift tax filings require fair market value to be established under applicable IRS rules. Certain filings may require a qualified appraisal by a qualified appraiser. The method used depends on the nature of the asset and the appraiser’s judgment. |
Where 409A Fits In
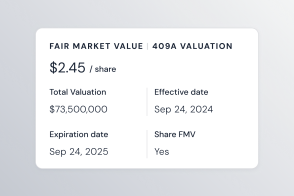
A 409A valuation is an independent appraisal used to establish the fair market value of a private company’s common stock, typically required when a company intends to grant stock options or other deferred compensation subject to Section 409A of the Internal Revenue Code. Failure to properly establish FMV before granting options can expose both the company and its employees to significant tax penalties under IRC Section 409A.
The IRS regulations provide several methods for establishing FMV, including a valuation by a qualified independent appraiser, which constitutes a safe-harbor method. A 409A valuation typically considers one or more of the three core approaches – DCF, Market Comps, and Asset-Based – depending on the company’s stage, available data, and circumstances. Value is then allocated across share classes using an Option Pricing Model (OPM) or Probability-Weighted Expected Return Method (PWERM).
Eqvista provides 409A valuation services designed to help private companies establish defensible fair market values for their common stock and support compliance with Section 409A requirements.
FAQs
Valuation raises a lot of questions, and the wrong answer to even one of them can cost you a deal, a funding round, or thousands in tax penalties. Here are the questions we get asked most often, answered plainly.
Venture Capital Method – calculating a pre-money valuation based on an anticipated exit valuation. The Berkus Method and Scorecard Method are also popular for pre-revenue companies.DCF can also be applied at earlier stages if sufficiently credible assumptions are available, though results tend to be highly sensitive to those assumptions given the inherent uncertainty involved.
A “triangulation“ approach. A typical professional valuation for a growth-stage startup might use DCF (intrinsic value), Market Comps (what the market pays), and an asset-based approach as an additional reference point.
When multiple methods produce reasonably consistent results, the valuation carries stronger support. Where they diverge, the gap often points to assumptions or risks worth examining further. Note that asset value does not automatically represent a minimum realizable value, as liquidation costs, liabilities, and marketability issues can all affect what assets are worth in practice.
Enterprise Value (EV) = Equity Value + Debt – Cash. EV represents the total value of the business regardless of capital structure. Equity Value is what shareholders own after debt is repaid. When applying multiples like EV/EBITDA or EV/Revenue, always use EV to avoid distortion from different debt levels across comparable companies.
Get a Defensible Company Valuation with Eqvista
A useful valuation should reflect the company’s financial performance, assets, growth prospects, market conditions, and the purpose of the valuation.
Eqvista’s valuation services combine certified expertise, AICPA-compliant methodology, and a streamlined online platform to deliver accurate, defensible valuations for startups and growth companies at every stage.
Whether you need a 409A valuation before your next option grant, a Fair Market Valuation for M&A or investor due diligence, or the Eqvista Real-Time Company Valuation for ongoing visibility into your company’s worth – start here.
Start Managing Your Equity with Eqvista
Build your cap table, manage equity, and keep ownership organized as your company grows.