What is the Hurdle Rate?
Identifying the hurdle rate and calculating the maximum acceptable entry valuation is straightforward.
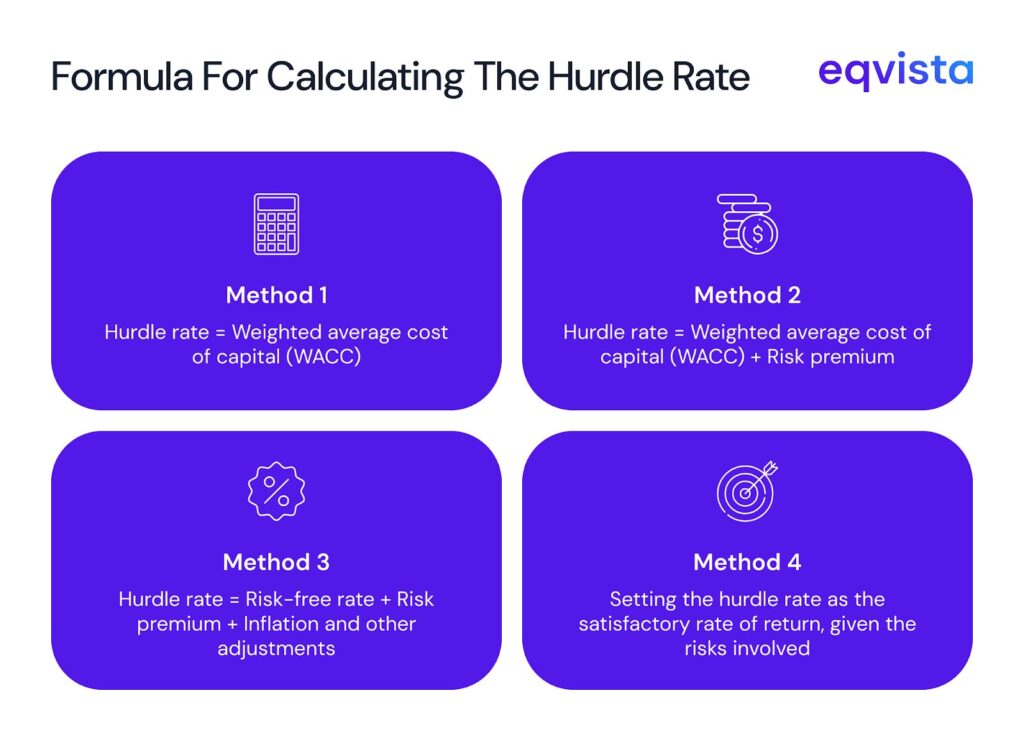
The hurdle rate is also known as the minimum acceptable rate of return (MARR). Typically, it is set equal to the weighted average cost of capital (WACC). If certain risks are not yet reflected in the WACC, you can set the hurdle rate as WACC plus a risk premium.
Another way to calculate the hurdle rate is to add a risk-premium and other relevant adjustments, such as inflation adjustment, to a baseline risk-free rate.
But the hurdle rate is a flexible and subjective concept. It is meant to help you quantify your risk tolerance and return expectations. So, you can set a hurdle rate for a particular investment opportunity after considering all material factors such as financial performance, industry benchmarks, risks specific to the company or industry, and macroeconomic risks.
How To Use Hurdle Rates?
Hurdle rates can be instrumental in guiding investment decision-making. If an investment’s internal rate of return (IRR) is at least as high as the hurdle rate, you should pursue the investment opportunity. If not, you should let the investment opportunity go.
Hurdle rates can also help you identify the maximum acceptable entry valuation.
Suppose a company’s WACC is 15%. Since it has become riskier, you add a 5% risk premium, setting the hurdle rate at 20%.
Your analysis suggests that this company should reach a valuation of $16 million after 5 years.
If that’s your exit valuation, what should be your entry valuation?
To find that out, you can simply discount the exit valuation by the hurdle rate as follows:
- Maximum acceptable entry valuation =Exit valuation/(1 + Hurdle rate)^Investment period
- =$16 million/(1+20%)^ 5=$16 million/2.48832= $6,430,041
So, the highest entry price you should accept, given the risk profile, is about $6.43 million.
Calculating Hurdle Rate
Each approach to estimating the hurdle rate involves incorporating different assumptions about risk, cost of capital, and market conditions.
The infographic below outlines the most commonly used methods for calculating it:

Ultimately, this rate should reflect the returns you would expect from a particular investment opportunity after knowing all the relevant facts.
Key Factors for Estimating the Hurdle Rate
The key factors for estimating the hurdle rate are as follows:
- Interest Rate – The interest rate paid by government securities, which are considered virtually risk-free, also represents the minimum return that must be earned to justify any investment.
- Risk Premium – The risk premium reflects the compensation for the additional risk of the investment in comparison to risk-free government securities.
- Inflation rate – Since inflation erodes the value of returns over time, it must be factored into the hurdle rate.
- Cost of Capital – The cost of capital is the return that must be earned to satisfy all investors. It serves as a benchmark return that a project must exceed to create value for all stakeholders.
Hurdle rate in private equity
General partners (GPs) manage private equity funds. They are responsible for raising funds from limited partners (LPs), deal sourcing, deal execution, portfolio management, and securing exits.
For taking on these responsibilities, GPs earn a portion of the fund’s profits as carried interest. But, before GPs are paid the carried interest, they must secure returns for the LPs as per the established hurdle rate.
Example of Hurdle Rate from Private Equity
Suppose that GPs contributed $2 million while LPs contributed $8 million to a private equity fund. This fund had a carried interest rate of 20% and a hurdle rate of 10%. 5 years later, when the fund had earned profits of $10 million, the GPs decided to close the fund. Let us see how these profits should be distributed when this fund is closed.
| Particulars | Amount |
|---|---|
| Funds contributed by LPs | $8,000,000 |
| Funds contributed by GPs | $2,000,000 |
| Total contributions to the fund | $10,000,000 |
| Fund value at date of closing | $20,000,000 |
| Proceeds returned to all partners | $10,000,000 |
| Hurdle rate | 10% |
| Distributions to LPs as per the hurdle rate | $4,884,080 |
| Proceeds available after distribution to LPs as per the hurdle rate | $5,115,920 |
| Carried interest rate | 20% |
| Distributions to GPs as per the carried interest rate | $1,023,184 |
| Proceeds to be distributed as per the monetary contributions | $4,092,736 |
First, the initial contributions are paid back to the partners. Once the LPs are paid as per the hurdle rate, the GPs are paid as per the carried interest rate. Then, the remaining proceeds are distributed as per the monetary contributions of each partner in the fund.
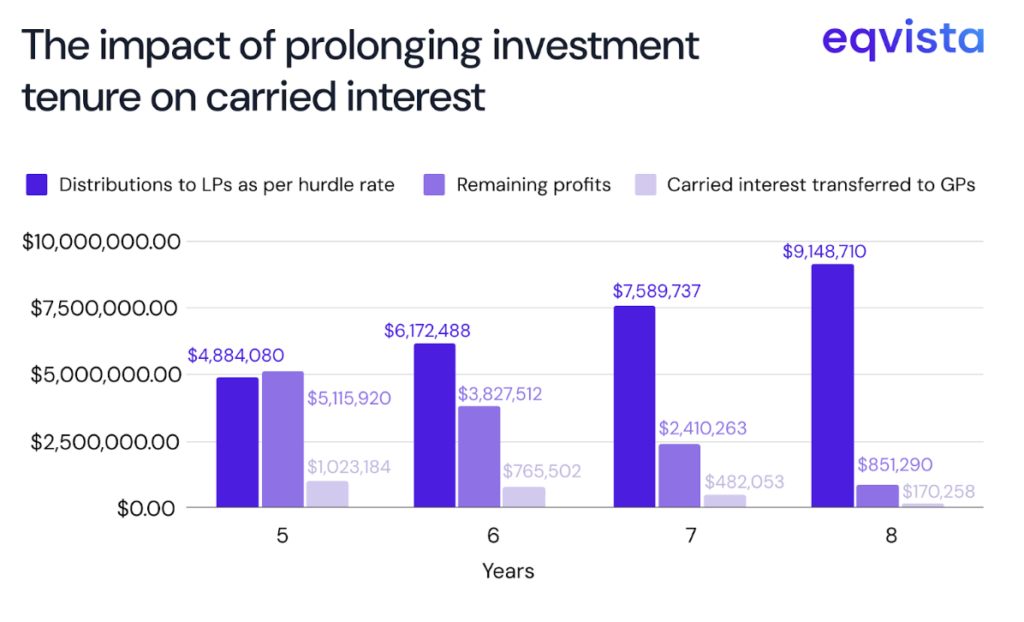
The 10% hurdle rate compounds every year. This incentivizes GPs to ensure timely exits. With each passing year, unless the fund’s growth is higher than the hurdle rate, the GPs will receive a smaller share of the profits.
The graph below illustrates how $10 million in profits would be distributed across investment tenures of 5, 6, 7, and 8 years.

Eqvista – Actionable insights at your fingertips!
Identifying the hurdle rate and calculating the maximum acceptable entry valuation is straightforward. The real difficulty lies in building reliable financial projections.
In acquisition scenarios, founders also face complexity when calculating stakeholder distributions, especially with layered clauses in shareholder agreements.
At Eqvista, we address both challenges. Our business valuation services support agile, data-driven decision-making, while our waterfall analysis tool helps you clearly visualize distributions according to each stakeholder’s rights and protections.
Contact us to learn more about our services!
Interested in issuing & managing shares?
If you want to start issuing and managing shares, Try out our Eqvista App, it is free and all online!