What Is Residual Value to Paid-In Capital (RVPI)?
In this article, we will explore the significance of RVPI for investors, its calculation methodology, and its relationship with TVPI and DPI.
A private equity fund’s current value is called its residual value, and its paid-in capital is the total contributions to the fund. The residual value is named as such because it is the value of assets left over after distributions to the investors.
The residual value to paid-in capital (RVPI) is a measure of the fund’s remaining value in relation to the contributions. This metric informs investors about the remaining value they can expect to extract from a particular fund.
Formula for Residual Value to Paid-In Capital
Residual value to paid-in capital (RVPI)=Residual value/Paid-in capital
As a fund is being closed, the RVPI shrinks due to distributions and eventually falls to zero.
In this article, we will explore the significance of RVPI for investors, its calculation methodology, and its relationship with TVPI and DPI.
RVPI’s Calculation and Its Relationship with TVPI and DPI
Suppose a private equity fund’s residual value, paid-in capital, and total value are $10 million, $20 million, and $60 million, respectively. Then, it can be calculated as:
- Residual value to paid-in capital RVPI=$10 million/$20 million = 0.5
Similarly, we can calculate the TVPI and DPI as:
- Total value to paid-in capital (TVPI)=$60 million/$20 million = 3
- Distributions to paid-in capital (DPI)=Total value-Residual value/Paid-in capital = $60 million-$10 million/$20 million = 2.5
In our example, the sum of RVPI (0.5) and DPI (2.5) equals TVPI (3). This is not a coincidence. A fund’s total value is the sum of distributions and residual value. So, the sum of distributions to paid-in capital (DPI) and RVPI always equals the total value to paid-in capital (TVPI).
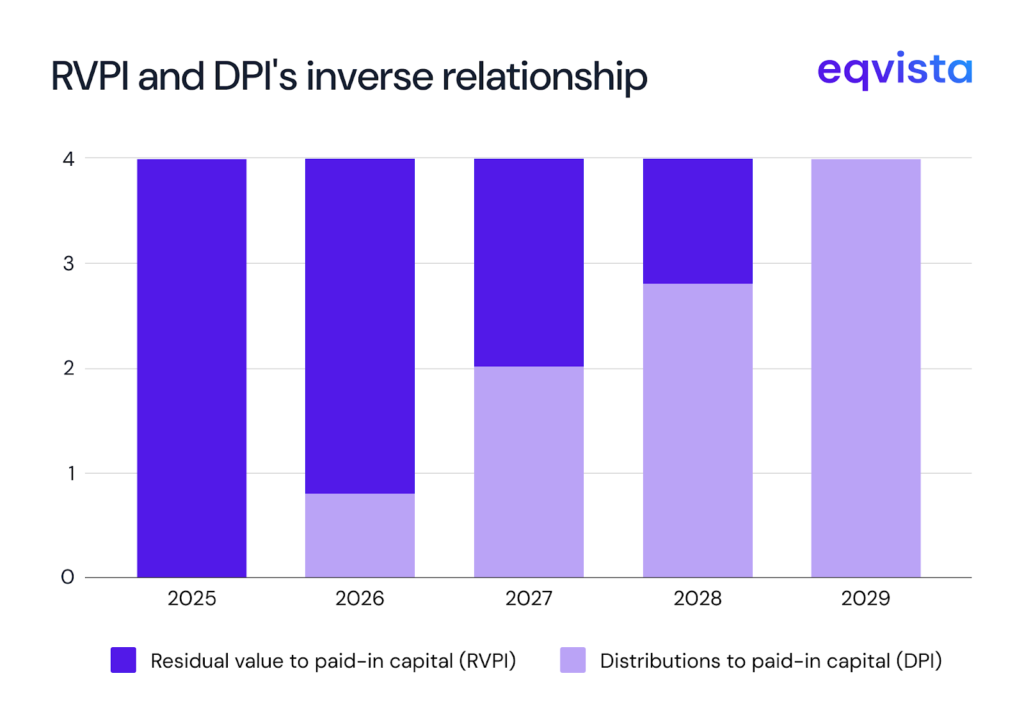
As mentioned earlier, RVPI will fall over time and eventually become zero. In this same period, the DPI increases until it eventually becomes equal to TVPI.
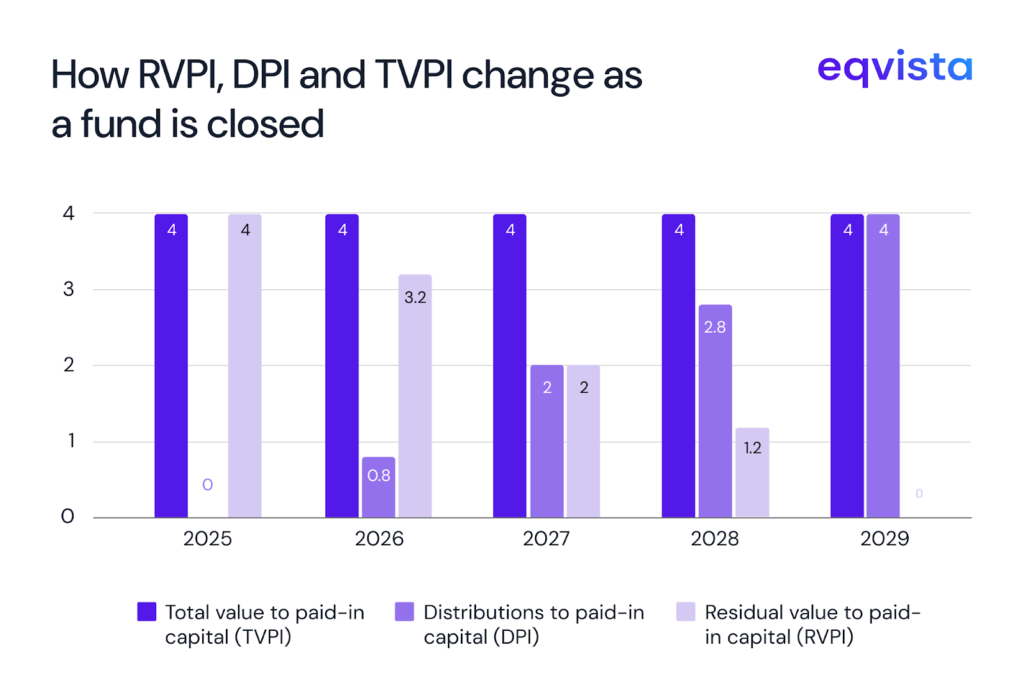
Let us visualize these characteristics of RVPI and DPI through an example, assuming that a private equity fund’s total value doesn’t change once it begins making distributions. Suppose a fund has a paid-in capital of $25 million and its closing stage plays out in the following manner:
| Year | 2025 | 2026 | 2027 | 2028 | 2029 |
|---|---|---|---|---|---|
| Total value | $100,000,000 | $100,000,000 | $100,000,000 | $100,000,000 | $100,000,000 |
| Cumulative Distributions | - | $20,000,000 | $50,000,000 | $70,000,000 | $100,000,000 |
| Residual value | $100,000,000 | $80,000,000 | $50,000,000 | $30,000,000 | - |
Then, the TVPI, DPI, and RVPI will be as follows:
| Year | Distributions ($ in M) | Residual Value ($ in M) | RVPI (Residual value / Paid in Capital of $25M) | DPI (Distributions / Paid in Capital of $25M) | TVPI |
|---|---|---|---|---|---|
| 2025 | 0 | 100 | 4 | 0 | 4 |
| 2026 | 20 | 80 | 3.2 | 0.8 | 4 |
| 2027 | 50 | 50 | 2 | 2 | 4 |
| 2028 | 70 | 30 | 1.2 | 2.8 | 4 |
| 2029 | 100 | 0 | 0 | 4 | 4 |
The inverse relationship between RVPI and DPI can be better visualized through a stacked column chart.
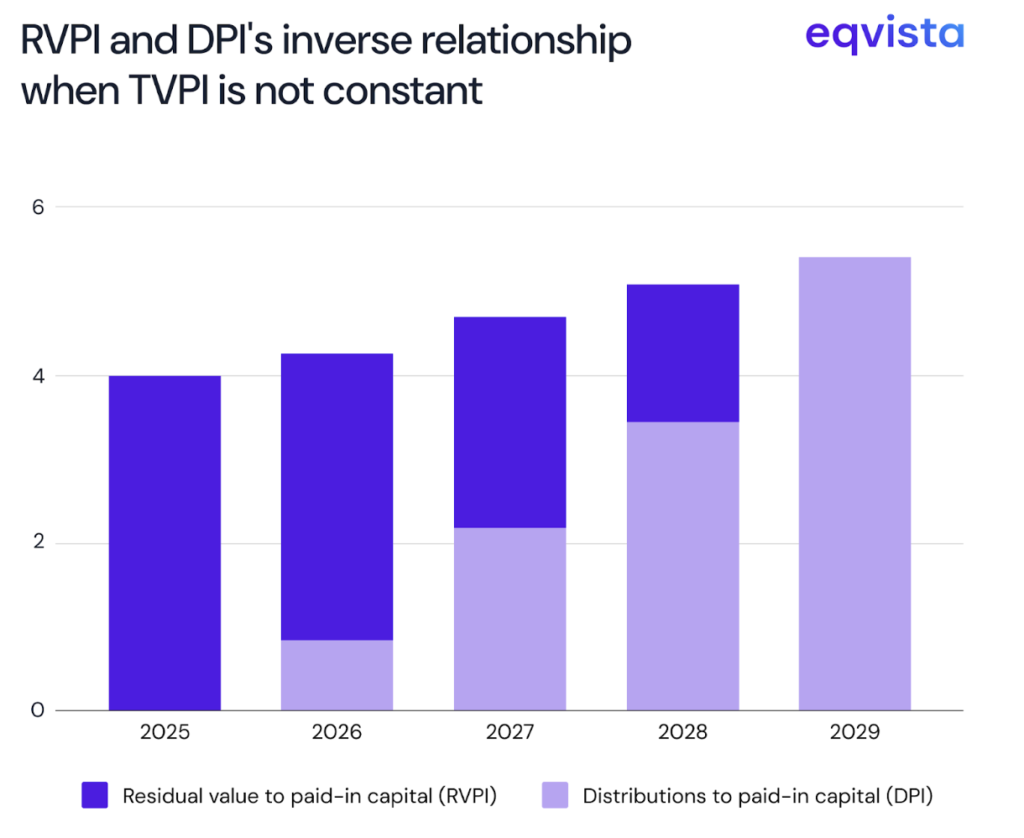
For the sake of simplicity, we assumed that the total value doesn’t change in the closing stage. Even if the total value changes, the relationship between RVPI, DPI, and TVPI isn’t affected.
What Is the Significance of RVPI?
RVPI is an important fund performance metric and plays a key role in informing investor decision-making in the following manner:
Exit Timing
When the RVPI remains stagnant, it may indicate that the current asset allocation has reached its optimal value, suggesting it could be time to consider liquidation. Continuing to hold the investment in such cases may dilute the time-adjusted rate of return.
Conversely, reallocating capital to higher-performing assets could enhance overall portfolio efficiency. Whether the reallocation can be pursued depends heavily on the liquidity needs of limited partners (LPs).
On the other hand, if the RVPI is increasing while the DPI remains unchanged, this may signal that extending the holding period could yield additional value before exiting.
Choosing General Partners
In the private equity space, the ability to identify high-performing investments is valuable only when matched by the ability to realize those gains through timely exits. Given the inherent illiquidity of this asset class, the capability to execute efficiently and within shorter timeframes becomes a critical differentiator of general partner (GP) performance.
RVPI can be a useful metric for assessing a GP’s effectiveness in managing and delivering exits. Consider the following three scenarios:
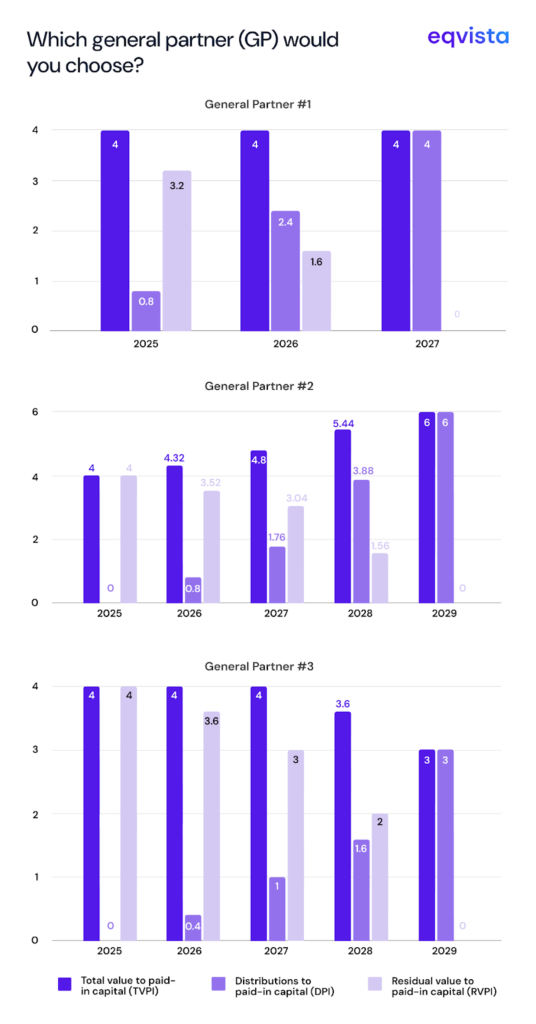
Observations:
- General Partner #1 demonstrates superior exit speed, completing exits roughly two years earlier than peers.
- General Partner #2 achieves the highest overall exit value, balancing timing and value realization effectively.
- General Partner #3 delayed exits excessively, leading to a decline in the fund’s total value.
From these RVPI trends, LPs are likely to favor General Partner #2 for maximizing value, while General Partner #1 may appeal more to LPs with a shorter investment horizon.
Assessing Valuation Practices
If a fund persistently maintains a high RVPI while distributions stagnate, it may suggest that the underlying assets are overvalued relative to current market conditions. This could indicate either of the following things:
- Making exits is difficult because private market liquidity is limited
- GP holds an overly optimistic view of asset values
- There are issues with the valuation methodology being applied
Conversely, if distributions rise quickly while RVPI erodes sharply, it may signal undervaluation. In this case, the fund might be:
- Applying an excessive illiquidity discount
- Taking an overly conservative view of asset worth, or
- Using a valuation approach that fails to capture fair market potential
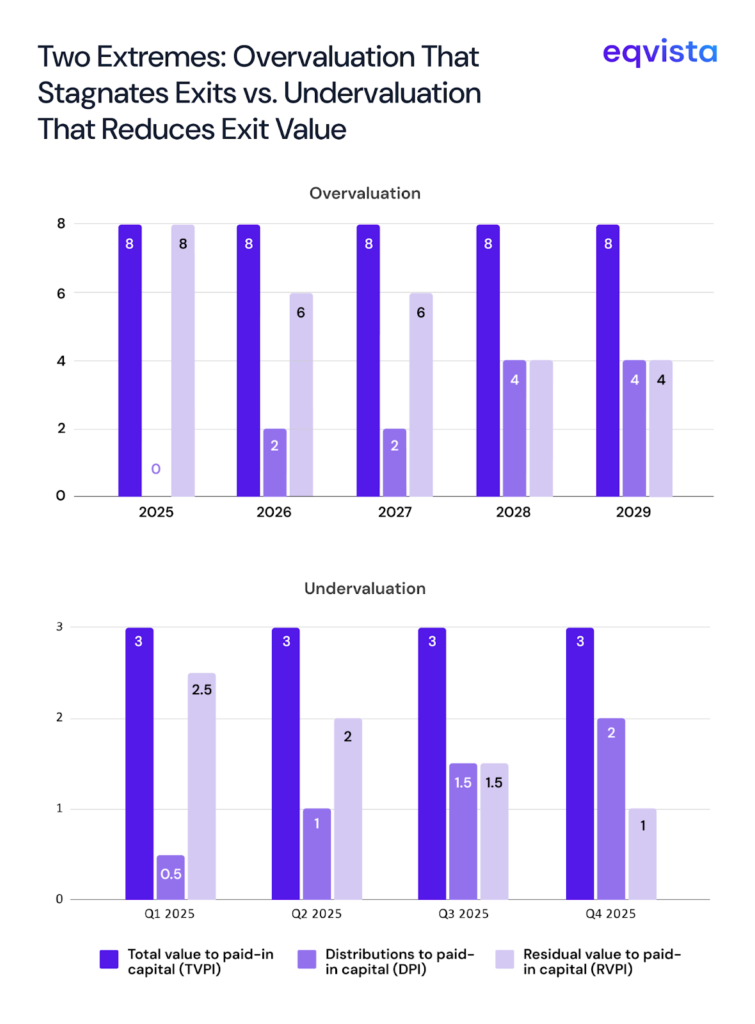
Thus, RVPI trends can serve as indicators of valuation accuracy, helping investors assess whether a fund’s reported values align with market realities.
Eqvista – Accuracy That Breeds Trust!
RVPI is more than just a performance ratio. It’s a dynamic indicator of a fund’s remaining value, exit efficiency, and valuation integrity. By tracking RVPI alongside DPI and TVPI, LPs can assess GP performance and potential valuation biases.
Understanding these relationships helps GPs make more informed decisions about capital reallocation and exit planning.
If you’re a GP looking to incorporate RVPI into your fund’s investor reporting, consider partnering with Eqvista. We deliver timely, data-driven, and accurate valuations that reinforce investor confidence in your reported RVPI and overall fund performance. Contact us to know more!
Interested in issuing & managing shares?
If you want to start issuing and managing shares, Try out our Eqvista App, it is free and all online!