A company’s ability to address its short-term financial commitments depends on how well it manages the resources available to its immediate debts. This balance is evaluated using a financial metric that compares current assets to current liabilities. This offers insight into the firm’s liquidity and operational efficiency.
Understanding this metric helps businesses anticipate potential cash flow challenges and make informed decisions. In this article, we have added a complete list of working capital ratios and insights.

What is the Working Capital Ratio?
The working capital ratio is also called the current ratio. Investors rely on this ratio to evaluate creditworthiness and financial stability. It is calculated using the formula:
Working Capital Ratio = Current Assets/Current Liabilities
- Current assets include cash, inventory, accounts receivable, and short-term investments.
- Current liabilities include debts and obligations such as accounts payable and short-term loans that are due within one year.
What is Working Capital?
Working capital is the difference between a company’s current assets and current liabilities. It represents the amount of money a business has available to support its short-term operations and obligations.
Working Capital = Current Assets – Current Liabilities
Working Capital Ratio: A Key Indicator of Financial Liquidity Health
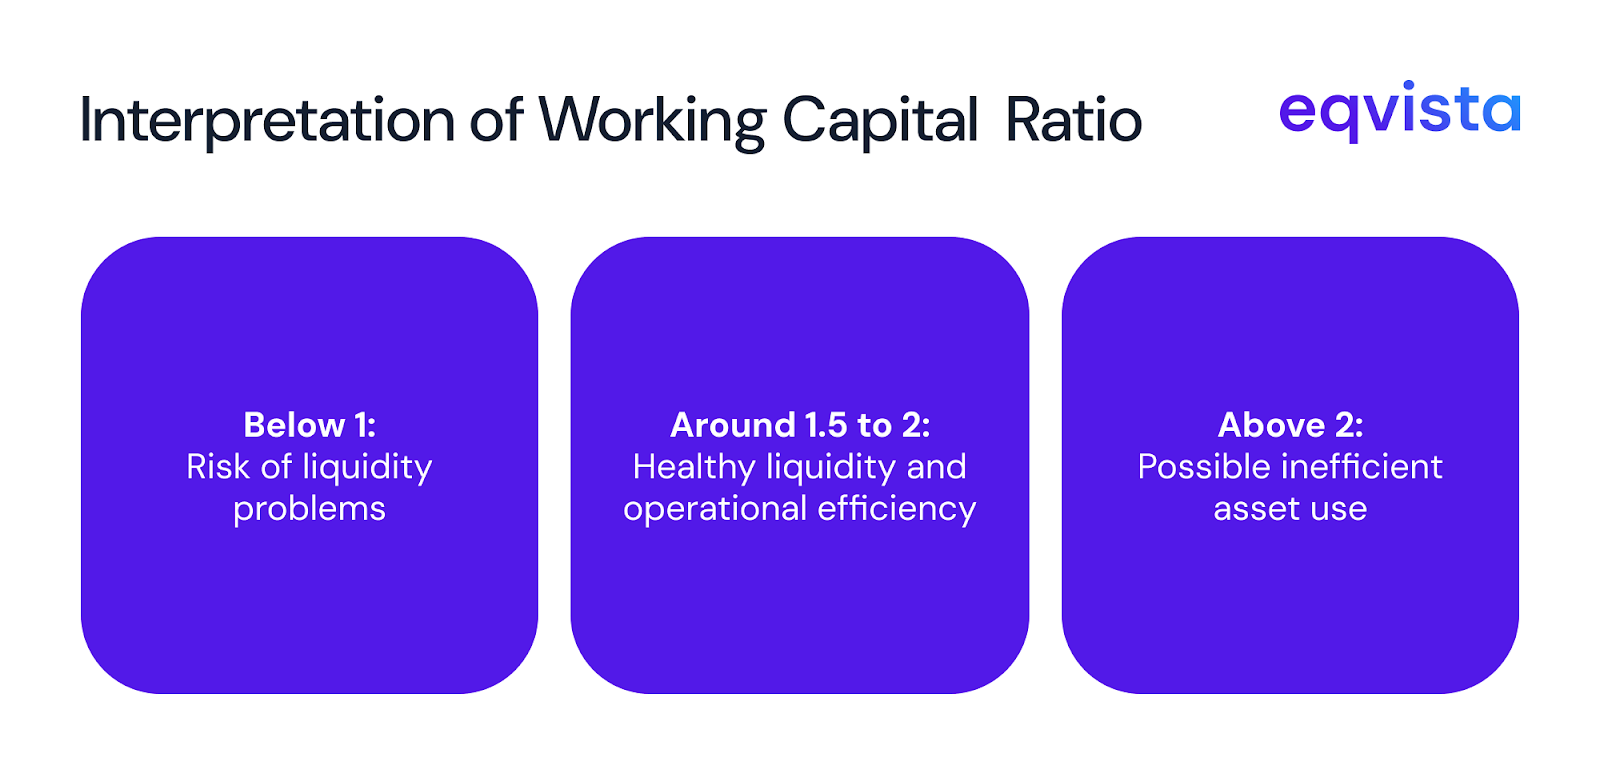
Current ratio indicates whether a company has enough short-term assets to cover its short-term liabilities.
Working capital Ratio between 1 and 1.5
A ratio of 1 and above 1.5 means the company has net positive working capital and can generally meet its short-term obligations. Exactly 1 means current assets just cover current liabilities, leaving little margin for unexpected expenses.
It is a leading indicator of operational health and financial stability, often considered by creditors and lenders when assessing creditworthiness.
| Industry | AVERAGE of WC Ratio |
|---|---|
| ARRANGEMENT OF TRANSPORTATION OF FREIGHT & CARGO | 1.0002 |
| ENGINES & TURBINES | 1.0078 |
| BEVERAGES | 1.0186 |
| X-RAY APPARATUS & TUBES & RELATED IRRADIATION APPARATUS | 1.0364 |
| WATER TRANSPORTATION | 1.0600 |
| CHEMICALS & ALLIED PRODUCTS | 1.0633 |
| PAPERBOARD CONTAINERS & BOXES | 1.0989 |
| SERVICES-PERSONAL SERVICES | 1.1025 |
| ELECTRIC & OTHER SERVICES COMBINED | 1.1086 |
| OFFICE FURNITURE (NO WOOD) | 1.1223 |
| RADIO BROADCASTING STATIONS | 1.1273 |
| PIPE LINES (NO NATURAL GAS) | 1.1337 |
| SECURITY & COMMODITY BROKERS, DEALERS, EXCHANGES & SERVICES | 1.1407 |
| SERVICES-HELP SUPPLY SERVICES | 1.1472 |
| COMPUTER STORAGE DEVICES | 1.1952 |
| RETAIL-MISCELLANEOUS RETAIL | 1.1992 |
| REAL ESTATE INVESTMENT TRUSTS | 1.2032 |
| WHOLESALE-GROCERIES & RELATED PRODUCTS | 1.2432 |
| MISCELLANEOUS PUBLISHING | 1.2501 |
| SOAP, DETERGENTS, CLEANG PREPARATIONS, PERFUMES, COSMETICS | 1.2572 |
| TELEVISION BROADCASTING STATIONS | 1.2581 |
| GENERAL INDUSTRIAL MACHINERY & EQUIPMENT | 1.2775 |
| RAILROAD EQUIPMENT | 1.2803 |
| RETAIL-AUTO & HOME SUPPLY STORES | 1.2862 |
| RETAIL-DEPARTMENT STORES | 1.3055 |
| TRUCKING (NO LOCAL) | 1.3104 |
| MISCELLANEOUS TRANSPORTATION EQUIPMENT | 1.3126 |
| SERVICES-HOSPITALS | 1.3227 |
| ELECTRONIC COMPUTERS | 1.3931 |
| CONSTRUCTION - SPECIAL TRADE CONTRACTORS | 1.3997 |
| CANNED, FROZEN & PRESERVD FRUIT, VEG & FOOD SPECIALTIES | 1.4160 |
| AIR TRANSPORTATION, SCHEDULED | 1.4230 |
| MISCELLANEOUS FOOD PREPARATIONS & KINDRED PRODUCTS | 1.4600 |
| GENERAL INDUSTRIAL MACHINERY & EQUIPMENT, NEC | 1.4747 |
| TRUCKING & COURIER SERVICES (NO AIR) | 1.4901 |
Key insights:
From the above data we can conclude that Industries with working capital ratios between 1.0 and 1.5 represent the “sweet spot” of liquidity management, demonstrating healthy but efficient capital allocation. Transportation and logistics companies cluster at the lower end (1.0-1.1) due to their asset-light, service-based models with quick cash conversion cycles, while retail and food processing industries occupy the higher end (1.3-1.5) as they require greater working capital for inventory management.
This range indicates mature, well-managed sectors that have optimized the balance between maintaining adequate liquidity buffers and avoiding excessive capital tied up in current assets.
Working capital ratio below 1
A ratio below 1 shows liquidity problems, as the company may struggle to pay its short-term debts. This situation suggests the business does not have enough short-term assets to cover debts and obligations.
| Industry | AVERAGE of WC Ratio |
|---|---|
| LAND SUBDIVIDERS & DEVELOPERS (NO CEMETERIES) | 0.0034 |
| SERVICES-MOTION PICTURE & VIDEO TAPE DISTRIBUTION | 0.0043 |
| COGENERATION SERVICES & SMALL POWER PRODUCERS | 0.0154 |
| SERVICES-GENERAL MEDICAL & SURGICAL HOSPITALS, NEC | 0.0359 |
| SERVICES-HOME HEALTH CARE SERVICES | 0.0382 |
| SERVICES-MISC HEALTH & ALLIED SERVICES, NEC | 0.0692 |
| RETAIL-CONVENIENCE STORES | 0.0876 |
| SERVICES-VIDEO TAPE RENTAL | 0.1029 |
| GUIDED MISSILES & SPACE VEHICLES & PARTS | 0.1248 |
| SERVICES-SPECIALTY OUTPATIENT FACILITIES, NEC | 0.1323 |
| SERVICES-MISCELLANEOUS BUSINESS SERVICES | 0.2423 |
| PRIMARY PRODUCTION OF ALUMINUM | 0.2469 |
| SERVICES-DIRECT MAIL ADVERTISING SERVICES | 0.2573 |
| PRINTING TRADES MACHINERY & EQUIPMENT | 0.2704 |
| WHOLESALE-MISCELLANEOUS NONDURABLE GOODS | 0.2996 |
| GLASS CONTAINERS | 0.3231 |
| FATS & OILS | 0.3912 |
| ELECTRONIC & OTHER ELECTRICAL EQUIPMENT (NO COMPUTER EQUIP) | 0.3948 |
| HAZARDOUS WASTE MANAGEMENT | 0.4031 |
| SERVICES-MOTION PICTURE THEATERS | 0.4686 |
| CEMENT, HYDRAULIC | 0.4927 |
| WHOLESALE-MISC DURABLE GOODS | 0.5074 |
| METAL MINING | 0.5211 |
| RETAIL-HOME FURNITURE, FURNISHINGS & EQUIPMENT STORES | 0.5252 |
| SERVICES-AUTOMOTIVE REPAIR, SERVICES & PARKING | 0.5300 |
| SERVICES-MOTION PICTURE & VIDEO TAPE PRODUCTION | 0.5543 |
| FOOTWEAR, (NO RUBBER) | 0.5550 |
| PREPARED FRESH OR FROZEN FISH & SEAFOODS | 0.5718 |
| WHOLESALE-APPAREL, PIECE GOODS & NOTIONS | 0.5729 |
| REFUSE SYSTEMS | 0.5768 |
| SERVICES-CHILD DAY CARE SERVICES | 0.5784 |
| DRAWING & INSULATING OF NONFERROUS WIRE | 0.5857 |
| MISCELLANEOUS PRODUCTS OF PETROLEUM & COAL | 0.6010 |
| SECURITY BROKERS, DEALERS & FLOTATION COMPANIES | 0.6062 |
| RETAIL-EATING PLACES | 0.6133 |
| PETROLEUM REFINING | 0.6261 |
| RETAIL-AUTO DEALERS & GASOLINE STATIONS | 0.6366 |
| TELEPHONE COMMUNICATIONS (NO RADIOTELEPHONE) | 0.6792 |
| PATENT OWNERS & LESSORS | 0.6801 |
| SERVICES-MEMBERSHIP SPORTS & RECREATION CLUBS | 0.6984 |
| SERVICES-AUTO RENTAL & LEASING (NO DRIVERS) | 0.7287 |
| WATER SUPPLY | 0.7296 |
| ELECTRIC, GAS & SANITARY SERVICES | 0.7431 |
| SERVICES-HEALTH SERVICES | 0.7488 |
| TRUCK & BUS BODIES | 0.7877 |
| RADIOTELEPHONE COMMUNICATIONS | 0.8018 |
| GAS & OTHER SERVICES COMBINED | 0.8053 |
| WHOLESALE-DRUGS, PROPRIETARIES & DRUGGISTS' SUNDRIES | 0.8256 |
| COMMERCIAL PRINTING | 0.8411 |
| HOUSEHOLD APPLIANCES | 0.8476 |
| SERVICES-NURSING & PERSONAL CARE FACILITIES | 0.8547 |
| RETAIL-EATING & DRINKING PLACES | 0.8743 |
| HOSPITAL & MEDICAL SERVICE PLANS | 0.8996 |
| SERVICES-ENGINEERING, ACCOUNTING, RESEARCH, MANAGEMENT | 0.8997 |
| RETAIL-CATALOG & MAIL-ORDER HOUSES | 0.9005 |
| SERVICES-MANAGEMENT SERVICES | 0.9153 |
| SERVICES-MISCELLANEOUS AMUSEMENT & RECREATION | 0.9270 |
| BLANKBOOKS, LOOSELEAF BINDERS & BOOKBINDG & RELATD WORK | 0.9291 |
| SPECIALTY CLEANING, POLISHING AND SANITATION PREPARATIONS | 0.9434 |
| GAMES, TOYS & CHILDREN'S VEHICLES (NO DOLLS & BICYCLES) | 0.9548 |
Key Insights:
Looking at this working capital ratio data for companies below 1.0, several key patterns emerge. The lowest ratios are found in capital-intensive sectors like land development (0.0034) and motion picture distribution (0.0043), which typically tie up resources in long-term assets rather than current assets. Service industries, particularly healthcare and entertainment, dominate the list due to their lower inventory requirements and faster cash conversion cycles.
While ratios below 1.0 generally indicate potential liquidity concerns where current assets don’t fully cover current liabilities, this must be interpreted within industry context—sectors like utilities (0.7431), petroleum refining (0.6261), and retail operations may strategically operate with lower working capital ratios to maximize efficiency and asset returns.
Working capital ratio above 2
Ratios significantly above 2 might suggest inefficient use of assets, where too much cash is held instead of being invested for growth.This suggests the business has ample liquidity to pay off its short-term debts and obligations comfortably.
| Industry | AVERAGE of WC Ratio |
|---|---|
| INDUSTRIAL TRUCKS, TRACTORS, TRAILORS & STACKERS | 2.0063 |
| WHOLESALE-METALS SERVICE CENTERS & OFFICES | 2.0063 |
| LAWN & GARDEN TRACTORS & HOME LAWN & GARDENS EQUIP | 2.0149 |
| SERVICES-COMMERCIAL PHYSICAL & BIOLOGICAL RESEARCH | 2.0281 |
| POULTRY SLAUGHTERING AND PROCESSING | 2.0369 |
| SERVICES-DETECTIVE, GUARD & ARMORED CAR SERVICES | 2.0409 |
| AIRCRAFT PARTS & AUXILIARY EQUIPMENT, NEC | 2.0715 |
| OIL & GAS FIELD SERVICES, NEC | 2.1096 |
| PAPER MILLS | 2.1339 |
| CRUDE PETROLEUM & NATURAL GAS | 2.1369 |
| MISC INDUSTRIAL & COMMERCIAL MACHINERY & EQUIPMENT | 2.1428 |
| CANNED, FRUITS, VEG, PRESERVES, JAMS & JELLIES | 2.1727 |
| INSURANCE AGENTS, BROKERS & SERVICE | 2.1907 |
| WHOLESALE-PROFESSIONAL & COMMERCIAL EQUIPMENT & SUPPLIES | 2.1930 |
| METAL FORGINGS & STAMPINGS | 2.2190 |
| RUBBER & PLASTICS FOOTWEAR | 2.2370 |
| REFRIGERATION & SERVICE INDUSTRY MACHINERY | 2.2649 |
| PRINTED CIRCUIT BOARDS | 2.2728 |
| TELEPHONE & TELEGRAPH APPARATUS | 2.2823 |
| SERVICES-RACING, INCLUDING TRACK OPERATION | 2.2872 |
| CALCULATING & ACCOUNTING MACHINES (NO ELECTRONIC COMPUTERS) | 2.2983 |
| SERVICES-CONSUMER CREDIT REPORTING, COLLECTION AGENCIES | 2.3377 |
| WHOLESALE-GROCERIES, GENERAL LINE | 2.3939 |
| MEAT PACKING PLANTS | 2.4376 |
| ELECTRONIC CONNECTORS | 2.4728 |
| SERVICES-BUSINESS SERVICES, NEC | 2.4896 |
| SERVICES-OFFICES & CLINICS OF DOCTORS OF MEDICINE | 2.5044 |
| DENTAL EQUIPMENT & SUPPLIES | 2.5216 |
| METAL DOORS, SASH, FRAMES, MOLDINGS & TRIM | 2.5360 |
| BOTTLED & CANNED SOFT DRINKS & CARBONATED WATERS | 2.5562 |
| BALL & ROLLER BEARINGS | 2.6000 |
| HOUSEHOLD FURNITURE | 2.6051 |
| SERVICES-COMPUTER PROGRAMMING, DATA PROCESSING, ETC. | 2.6148 |
| ORTHOPEDIC, PROSTHETIC & SURGICAL APPLIANCES & SUPPLIES | 2.6327 |
| RETAIL-SHOE STORES | 2.6467 |
| SERVICES-PREPACKAGED SOFTWARE | 2.6589 |
| COMMUNICATIONS EQUIPMENT, NEC | 2.6829 |
| MOTORCYCLES, BICYCLES & PARTS | 2.6989 |
| MINING & QUARRYING OF NONMETALLIC MINERALS (NO FUELS) | 2.7027 |
| SPECIAL INDUSTRY MACHINERY (NO METALWORKING MACHINERY) | 2.7255 |
| SURGICAL & MEDICAL INSTRUMENTS & APPARATUS | 2.7726 |
| SERVICES-MANAGEMENT CONSULTING SERVICES | 2.7735 |
| ORDNANCE & ACCESSORIES, (NO VEHICLES/GUIDED MISSILES) | 2.8356 |
| SERVICES-EDUCATIONAL SERVICES | 2.8369 |
| INDUSTRIAL INORGANIC CHEMICALS | 2.8857 |
| WHOLESALE-FARM PRODUCT RAW MATERIALS | 2.9019 |
| FABRICATED STRUCTURAL METAL PRODUCTS | 2.9129 |
| SERVICES-COMPUTER PROCESSING & DATA PREPARATION | 2.9327 |
| SERVICES-ADVERTISING AGENCIES | 2.9332 |
| RETAIL-JEWELRY STORES | 2.9585 |
| ELECTRONIC COILS, TRANSFORMERS & OTHER INDUCTORS | 2.9787 |
| TEXTILE MILL PRODUCTS | 3.0190 |
| COMMUNICATIONS SERVICES, NEC | 3.0801 |
| WHOLESALE-HARDWARE & PLUMBING & HEATING EQUIPMENT & SUPPLIES | 3.1304 |
| AGRICULTURAL SERVICES | 3.1447 |
| LOAN BROKERS | 3.1475 |
| AIRCRAFT ENGINES & ENGINE PARTS | 3.1675 |
| APPAREL & OTHER FINISHD PRODS OF FABRICS & SIMILAR MATL | 3.1911 |
| SERVICES-COMPUTER PROGRAMMING SERVICES | 3.2176 |
| WHOLESALE-COMPUTERS & PERIPHERAL EQUIPMENT & SOFTWARE | 3.2333 |
| STEEL WORKS, BLAST FURNACES & ROLLING & FINISHING MILLS | 3.2892 |
| REAL ESTATE | 3.3394 |
| MOTORS & GENERATORS | 3.3468 |
| RETAIL-BUILDING MATERIALS, HARDWARE, GARDEN SUPPLY | 3.4246 |
| STEEL WORKS, BLAST FURNACES & ROLLING MILLS (COKE OVENS) | 3.4353 |
| MISCELLANEOUS CHEMICAL PRODUCTS | 3.4391 |
| HOTELS, ROOMING HOUSES, CAMPS & OTHER LODGING PLACES | 3.5452 |
| RAILROADS, LINE-HAUL OPERATING | 3.5529 |
| IN VITRO & IN VIVO DIAGNOSTIC SUBSTANCES | 3.5926 |
| MISCELLANEOUS METAL ORES | 3.6244 |
| MISCELLANEOUS ELECTRICAL MACHINERY, EQUIPMENT & SUPPLIES | 3.6664 |
| FINANCE SERVICES | 3.6725 |
| ELECTROMEDICAL & ELECTROTHERAPEUTIC APPARATUS | 3.6797 |
| SERVICES-COMPUTER INTEGRATED SYSTEMS DESIGN | 3.7074 |
| CUTLERY, HANDTOOLS & GENERAL HARDWARE | 3.8785 |
| AGRICULTURAL PRODUCTION-CROPS | 4.0077 |
| OPHTHALMIC GOODS | 4.0114 |
| MOBILE HOMES | 4.0249 |
| ELECTRONIC COMPONENTS & ACCESSORIES | 4.0688 |
| AGRICULTURAL CHEMICALS | 4.1081 |
| HEAVY CONSTRUCTION OTHER THAN BLDG CONST - CONTRACTORS | 4.1094 |
| SEMICONDUCTORS & RELATED DEVICES | 4.2375 |
| PULP MILLS | 4.2602 |
| SERVICES-ENGINEERING SERVICES | 4.3013 |
| SERVICES-ADVERTISING | 4.3303 |
| SPORTING & ATHLETIC GOODS, NEC | 4.4141 |
| NATURAL GAS DISTRIBUTION | 4.4663 |
| ELECTRONIC COMPONENTS, NEC | 4.5656 |
| COMPUTER COMMUNICATIONS EQUIPMENT | 4.6118 |
| MANIFOLD BUSINESS FORMS | 4.7160 |
| SAUSAGES & OTHER PREPARED MEAT PRODUCTS | 4.7401 |
| Office of Real Estate & Construction | 4.7659 |
| GOLD AND SILVER ORES | 4.8081 |
| PLASTICS PRODUCTS, NEC | 4.9949 |
| MEASURING & CONTROLLING DEVICES, NEC | 5.0104 |
| OIL & GAS FIELD EXPLORATION SERVICES | 5.0815 |
| NATURAL GAS TRANSMISSION | 5.2669 |
| LABORATORY ANALYTICAL INSTRUMENTS | 5.4676 |
| ELECTRICAL INDUSTRIAL APPARATUS | 5.5645 |
| COMPUTER PERIPHERAL EQUIPMENT, NEC | 5.8510 |
| BIOLOGICAL PRODUCTS, (NO DISGNOSTIC SUBSTANCES) | 5.9680 |
| TOBACCO PRODUCTS | 5.9712 |
| OPERATORS OF NONRESIDENTIAL BUILDINGS | 6.0191 |
| BITUMINOUS COAL & LIGNITE SURFACE MINING | 6.5488 |
| SERVICES-MEDICAL LABORATORIES | 6.6087 |
| PHARMACEUTICAL PREPARATIONS | 6.6889 |
| OPTICAL INSTRUMENTS & LENSES | 6.8451 |
| AIR-COND & WARM AIR HEATG EQUIP & COMM & INDL REFRIG EQUIP | 6.9413 |
| MEDICINAL CHEMICALS & BOTANICAL PRODUCTS | 7.1641 |
| SEARCH, DETECTION, NAVAGATION, GUIDANCE, AERONAUTICAL SYS | 7.5115 |
| INDUSTRIAL PROCESS FURNACES & OVENS | 8.0639 |
| SPECIAL INDUSTRY MACHINERY, NEC | 8.0879 |
| MOTOR VEHICLES & PASSENGER CAR BODIES | 8.1730 |
| DRILLING OIL & GAS WELLS | 8.5132 |
| AGRICULTURAL PROD-LIVESTOCK & ANIMAL SPECIALTIES | 8.6792 |
| INVESTMENT ADVICE | 11.3012 |
| INVESTORS, NEC | 11.6708 |
| COATING, ENGRAVING & ALLIED SERVICES | 12.2917 |
| SERVICES-TO DWELLINGS & OTHER BUILDINGS | 12.8421 |
| INDUSTRIAL INSTRUMENTS FOR MEASUREMENT, DISPLAY, AND CONTROL | 15.5423 |
| HOTELS & MOTELS | 18.1198 |
| WHOLESALE-MACHINERY, EQUIPMENT & SUPPLIES | 19.6016 |
Key Insights:
The data reveals significant industry variations, with ratios spanning from just above 2.0 to nearly 20.0, indicating vastly different liquidity management strategies across sectors. Manufacturing and industrial companies cluster in the efficient 2.0-4.0 range, reflecting mature operations with optimized cash cycles, while technology and healthcare sectors show higher ratios driven by R&D funding needs and high-value inventory requirements.
Service industries display mixed patterns, with investment services and hotels showing exceptionally high ratios (11.30 -18.12) that may indicate either conservative risk management or potential capital inefficiency.
Working capital ratio between 1.5 and 2.0
A working capital ratio that falls between 1.5 and 2.0 is generally considered healthy and indicates strong financial stability for a company. In this range the company has $1.50- $2.00 in current assets for every $1.00 of liabilities, showing it has sufficient liquidity to cover short-term obligations while maintaining a comfortable buffer.
| Industry | AVERAGE of WC Ratio |
|---|---|
| ELECTRICAL WORK | 1.5152 |
| SERVICES-AMUSEMENT & RECREATION SERVICES | 1.5154 |
| ELECTRIC HOUSEWARES & FANS | 1.5216 |
| FABRICATED PLATE WORK (BOILER SHOPS) | 1.5218 |
| ELECTRIC LIGHTING & WIRING EQUIPMENT | 1.5245 |
| NEWSPAPERS: PUBLISHING OR PUBLISHING & PRINTING | 1.5310 |
| FOOD AND KINDRED PRODUCTS | 1.5534 |
| RETAIL-FAMILY CLOTHING STORES | 1.5661 |
| SANITARY SERVICES | 1.5747 |
| NONFERROUS FOUNDRIES (CASTINGS) | 1.5883 |
| OFFICE FURNITURE | 1.5998 |
| SERVICES-EQUIPMENT RENTAL & LEASING, NEC | 1.6009 |
| MISCELLANEOUS MANUFACTURING INDUSTRIES | 1.6033 |
| HEATING EQUIP, EXCEPT ELEC & WARM AIR; & PLUMBING FIXTURES | 1.6106 |
| INDUSTRIAL ORGANIC CHEMICALS | 1.6125 |
| WATCHES, CLOCKS, CLOCKWORK OPERATED DEVICES/PARTS | 1.6191 |
| PERFUMES, COSMETICS & OTHER TOILET PREPARATIONS | 1.6431 |
| PLASTIC MATERIALS, SYNTH RESINS & NONVULCAN ELASTOMERS | 1.6599 |
| CABLE & OTHER PAY TELEVISION SERVICES | 1.6792 |
| BROADWOVEN FABRIC MILLS, COTTON | 1.6840 |
| METALWORKG MACHINERY & EQUIPMENT | 1.6964 |
| MOTOR VEHICLE PARTS & ACCESSORIES | 1.6986 |
| ROLLING DRAWING & EXTRUDING OF NONFERROUS METALS | 1.6998 |
| WHOLESALE-MOTOR VEHICLES & MOTOR VEHICLE PARTS & SUPPLIES | 1.7142 |
| WATER, SEWER, PIPELINE, COMM & POWER LINE CONSTRUCTION | 1.7525 |
| RETAIL-MISCELLANEOUS SHOPPING GOODS STORES | 1.7590 |
| OIL & GAS FIELD MACHINERY & EQUIPMENT | 1.7772 |
| FUNCTIONS RELATED TO DEPOSITORY BANKING, NEC | 1.7905 |
| TRANSPORTATION SERVICES | 1.7969 |
| SECONDARY SMELTING & REFINING OF NONFERROUS METALS | 1.8070 |
| ADHESIVES & SEALANTS | 1.8242 |
| PUMPS & PUMPING EQUIPMENT | 1.8286 |
| NATURAL GAS TRANSMISISON & DISTRIBUTION | 1.8368 |
| STEEL PIPE & TUBES | 1.8385 |
| ELECTRIC SERVICES | 1.8402 |
| INDUSTRIAL & COMMERCIAL FANS & BLOWERS & AIR PURIFING EQUIP | 1.8575 |
| HOUSEHOLD AUDIO & VIDEO EQUIPMENT | 1.8901 |
| RETAIL-RETAIL STORES, NEC | 1.8968 |
| AIR TRANSPORTATION, NONSCHEDULED | 1.9008 |
| PAINTS, VARNISHES, LACQUERS, ENAMELS & ALLIED PRODS | 1.9069 |
| RADIO & TV BROADCASTING & COMMUNICATIONS EQUIPMENT | 1.9118 |
| DEEP SEA FOREIGN TRANSPORTATION OF FREIGHT | 1.9199 |
| AIRCRAFT | 1.9253 |
| MEN'S & BOYS' FURNISHGS, WORK CLOTHG, & ALLIED GARMENTS | 1.9396 |
| MILLWOOD, VENEER, PLYWOOD, & STRUCTURAL WOOD MEMBERS | 1.9401 |
| REAL ESTATE AGENTS & MANAGERS (FOR OTHERS) | 1.9602 |
| LEATHER & LEATHER PRODUCTS | 1.9772 |
| CONVERTED PAPER & PAPERBOARD PRODS (NO CONTANERS/BOXES) | 1.9865 |
| SHIP & BOAT BUILDING & REPAIRING | 1.9898 |
Key Insights:
Industries operating with working capital ratios between 1.5 – 2.0 represent sectors with tight but generally adequate liquidity management, balancing efficiency with financial stability. This range includes diverse sectors from utilities and manufacturing (electrical work 1.52, electric services 1.84) to consumer goods and retail (family clothing stores 1.57, cosmetics 1.64), indicating established industries with predictable cash flows and efficient working capital cycles.
Traditional manufacturing sectors like motor vehicle parts (1.70), metalworking machinery (1.70), and industrial chemicals (1.61-1.66) demonstrate mature supply chain relationships and optimized inventory management, while service sectors such as transportation (1.80) and equipment rental (1.60) maintain lean operations with necessary liquidity buffers.
These ratios suggest companies operating at optimal efficiency levels—close enough to 1.0 to indicate strong cash conversion cycles, yet sufficiently above 1.5 to provide adequate protection against short-term financial stress, representing the “sweet spot” of working capital management for many established industries.
Key to Business Liquidity and Financial Health with Eqvista
Understanding the current ratio is crucial for managing a company’s liquidity. Accurate analysis not only gives business’s ability to meet short-term obligations but also plays a vital role in company valuation and long-term financial planning.
Eqvista offers tools that are beneficial for businesses aiming to optimize their financial management. The platform’s features, such as real-time analytics, financial modeling, and compliance support, streamline equity and management for startups and established companies.
Try Eqvista today and experience efficient, data-driven business management.


