Private Market Liquidity Crisis: IPO Dryup Traps Company Cash
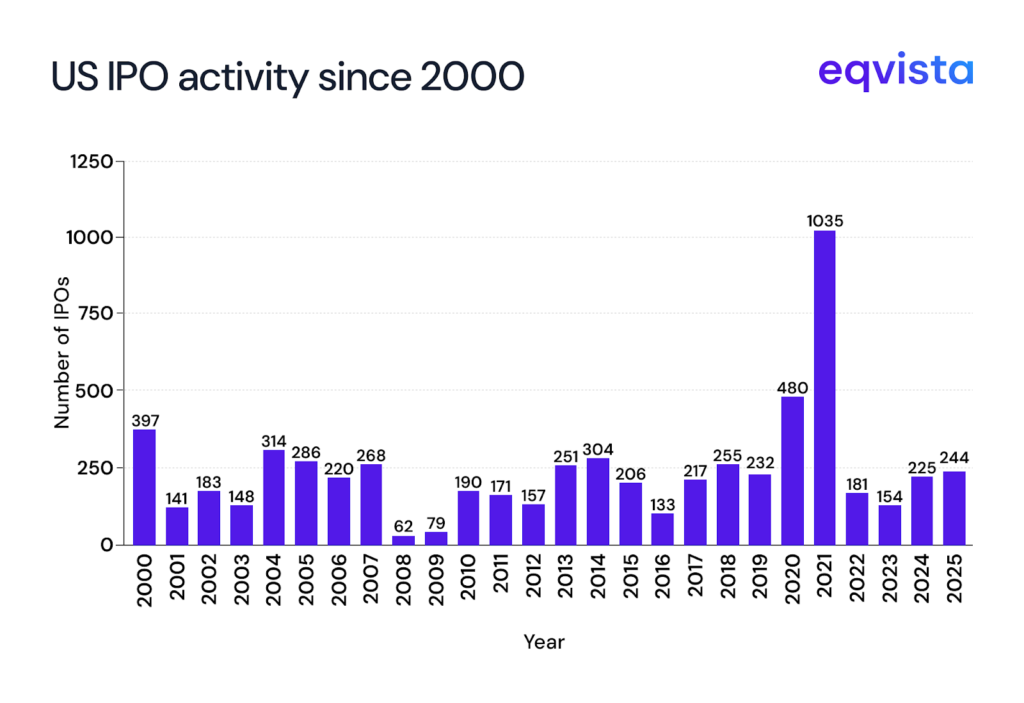
In 2022, US IPO activity plummeted by 83% and has yet to recover to the levels seen in 2021 or even 2020. However, the surge of IPOs in those years has distorted expectations of what ‘normal’ looks like for the market. Looking back over two decades, the median annual number of IPOs since 2000 is 218.5.

Both 2024 and 2025 have already exceeded that threshold, suggesting activity isn’t historically low. It just feels that way compared to the extraordinary boom of 2021.

So, why do investors remain restless?
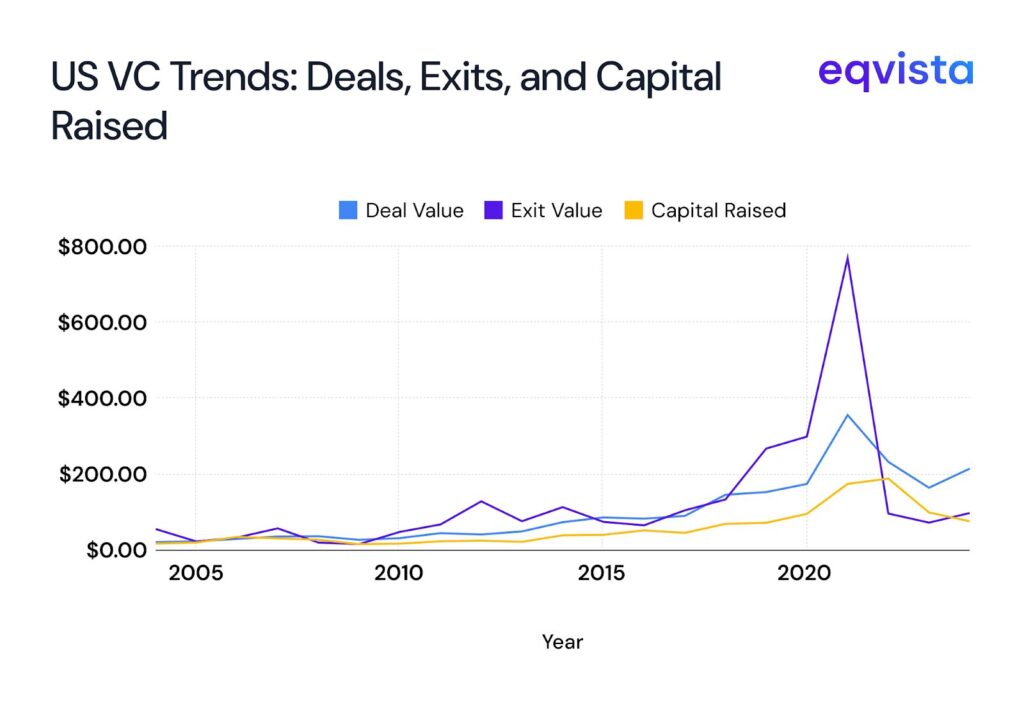
The answer lies in exits. Historically, exit value has tracked closely with deal value and capital raised. But in 2021, exit value spiked to an unprecedented $767.42 billion, creating a benchmark that subsequent years haven’t come close to matching.
Since then, deal values and fundraising have declined, while exit values have lagged even further.
This mismatch has made VC investors increasingly anxious. In fact, 2024 marked the first time on record that the three-year rolling total of exit value came in lower than the deal value from three years prior. This is a worrying sign for investors waiting on liquidity.

Similar trends can be observed in private equity, where exits have slowed and fundraising has contracted. After reaching a peak of 6,132 fund closings in 2021, activity has steadily receded, with only 1,783 funds closing in 2024.
Join us as we explore how this lack of liquidity causes cash flow mismatches and how limited partners (LPs) and general partners (GPs) are dealing with this situation.
How Fewer Exits Trigger Cash Flow Mismatches?
Preqin data shows that, since 2018, the total capital called has exceeded capital distributions by $1.57 trillion, highlighting the liquidity shortfall faced by investors.
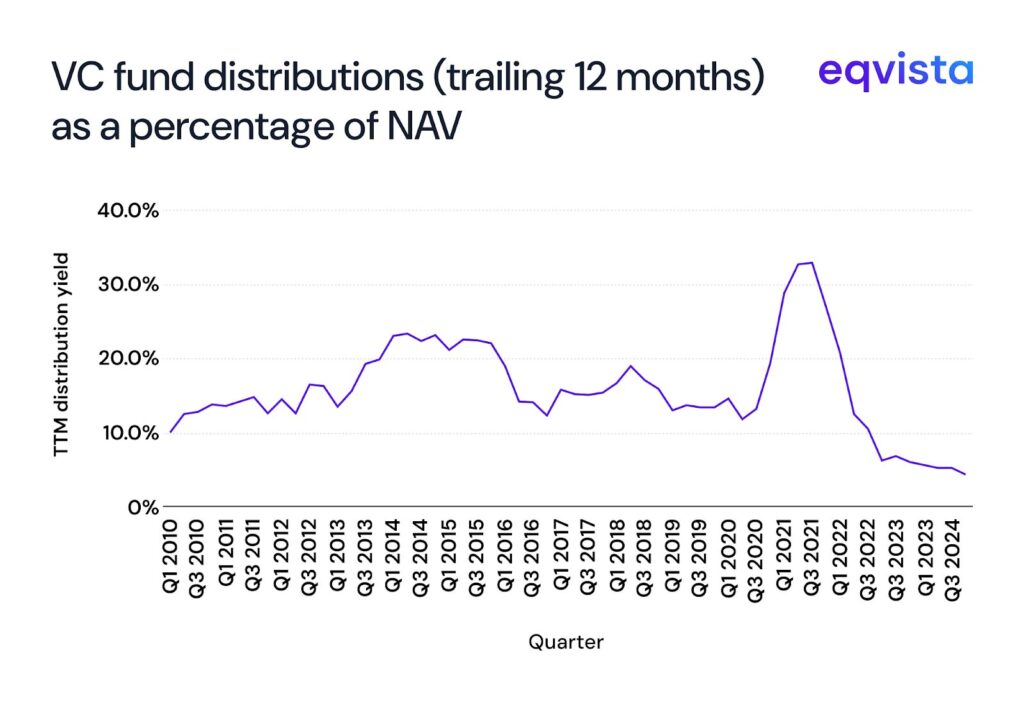
In venture capital, the strain is particularly visible in fund distributions. For more than a decade, US VC fund distributions consistently exceeded 10% of NAV. This gave LPs confidence in recycling capital. But in Q4 2022, this metric fell below 10% and has stayed there ever since, reaching a low of 4.3% in Q2 2024.

While PitchBook forecasts a recovery back to 10% by Q3 2025, the prolonged slump highlights why LPs are anxious about liquidity.
On the other hand, liquidity issues in private equity are evidenced by longer holding periods. The median holding period for US PE-backed companies has stretched from 2.42 years in 2018 to 3.42 years in 2024.
In Europe, companies held by buyout groups were held for an average of nearly 6 years in 2024, the highest since at least 2010. Longer holding periods also impact PE fund returns. Assets held for more than seven years have been growing at just 6.5% annually, less than half the growth rate of those owned for under three years.
How Are Investors Managing the Liquidity Gap?
In 2024, the global LP-led secondary transactions grew by 45% on a year-on-year (YoY) basis. Since 2020, the growth in deal volumes for secondary transactions has outpaced IPOs and M&A volumes. In this period, secondary transaction volume almost tripled while M&A stagnated and IPO volume shrank to just a third of its prior size.
Robust demand in the secondary market is reflected in steadily improving pricing. For LP-led transactions overall, average pricing rose from 81% of NAV in 2022 to 89% in 2024. Buyout funds led the way, climbing from 87% to 94% over the same period. Venture funds, while more volatile, also showed resilience. After dipping from 68% in 2022 to 67% in 2023, pricing rebounded sharply to 75% in 2024.
While LPs have warmed up to secondary market transactions on account of healthy demand, they remain apprehensive of new commitments. 2024 was the third consecutive drop in private equity fundraising, dropping from a high of $1 trillion in 2021 to a 9-year low of $680 billion in 2024.
2025 looks like it will continue the downward trend, as the global PE fundraising in its first quarter was 35% lower on a YoY basis.
How Have GPs Responded to This Situation?
Two structural shifts that are reshaping how GPs are addressing the liquidity squeeze are the growing use of continuation vehicles (CVs) and the rapid rise of NAV financing.
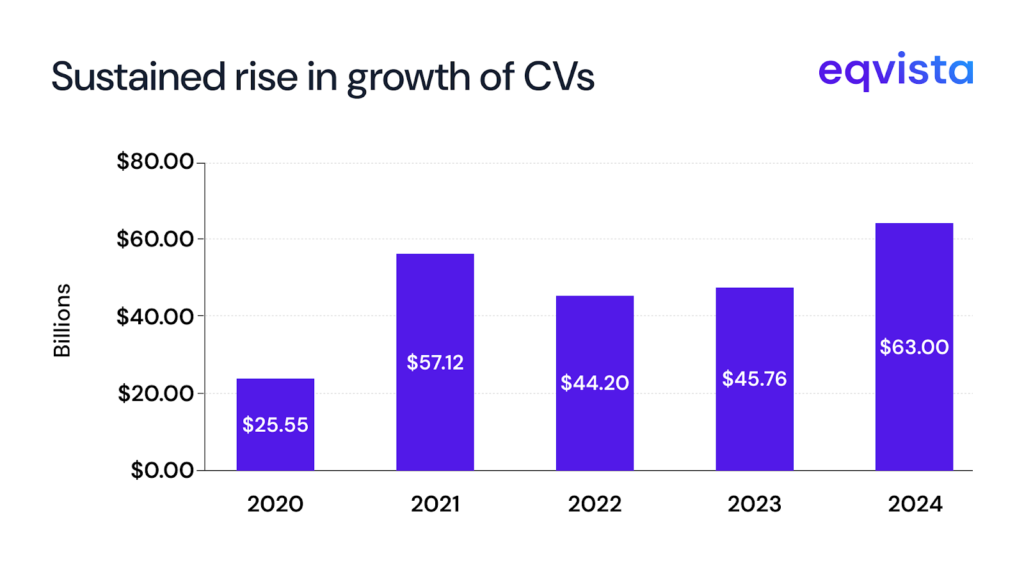
Continuation vehicles, which allow GPs to roll high-conviction assets into new funds while offering LPs a liquidity option, surged to $57 billion in 2021 and have remained elevated, reaching $63 billion in 2024.

The CV activity shows no signs of slowing. 77 continuation funds closed in 2024, and in just the first half of 2025, 54 funds have already closed, raising $25 billion. Notably, the number of managers closing their first CV jumped by 25% in 2024, suggesting that the private equity market as a whole is opening up to CVs.
In parallel, NAV financing has become a key liquidity tool. Between 2020 and 2023, deal flow more than doubled to $44 billion, and the market is projected to grow more than threefold to $145 billion by 2030. This trajectory underscores how fund-level leverage is increasingly being used to bridge capital needs and smooth distributions in a slow exit environment.
Eqvista- Empowering Informed and Agile Decision-Making!
The current liquidity crunch in private equity markets is less of a collapse in activity than a result of distorted expectations and prolonged holding periods. As exits remain scarce and alternative liquidity tools gain traction, investors will face increasing pressure to make informed decisions in real time.
This is where timely, accurate valuations become essential. By partnering with a trusted provider like Eqvista, investors gain real-time insights that help them navigate liquidity mismatches, evaluate secondary opportunities, and pace new commitments with confidence in an environment where clarity is at a premium. Contact us to know more!
