A cap table records who owns a company and under what terms; a waterfall model uses that same data to calculate who gets paid, and how much, when the company is sold.
Building an investor-ready cap table and waterfall model is one of the most important steps in startup financial planning. A startup can look healthy on the surface and still create confusion at exit if its ownership records are messy. That is why it should be treated as a single document, not two separate documents; the cap table is the input, and the waterfall is the output.
Platforms like Eqvista keep both in one system specifically so an update to the cap table automatically feeds the next waterfall run.

Captable vs. Waterfall Analysis
A cap table is a record of every security a company has issued, common stock, preferred stock, the option pool, SAFEs, and convertible notes, along with who holds it and on what terms. A waterfall model is a financial calculation that takes the ownership data and simulates what each holder receives in a specific exit scenario.
In short, the relationship is sequential, not parallel. The cap table has to be accurate first because every number in the waterfall is pulled directly from it.
Why do investors review these documents in Due Diligence?
Ownership percentage alone doesn’t tell an investor what they’ll actually receive. A founder holding 40% of a company can end up with less cash at exit than a preferred investor holding 10%, because liquidation preferences are paid out before anything is split by ownership stake. Investors request the cap table to see how equity is structured and what could dilute their position, and the waterfall to see what they’d recover under different exit outcomes.
This is where an outdated cap table causes the most damage. If a financing round or SAFE conversion isn’t reflected yet, the waterfall built on top of it will misstate diluted ownership for every shareholder class, not just the one that changed. Eqvista’s liquidation preference resources go deeper into how the preference stack determines payout order.
How do you Build the Ownership Base of a Cap Table?
Start by listing every issued security in order of seniority: common stock first, then preferred stock, then the option pool, then convertibles. This structure makes the cap table easier to audit, reconcile, and connect to the waterfall model later.
The table below shows a typical cap table structure for an early-stage startup.
Cap Table Structure: Early-Stage Example
| Holder | Security Type | Shares / Units | Issue Date | Conversion / Term | Fully Diluted Shares | Ownership % |
|---|---|---|---|---|---|---|
| Founder 1 | Common Stock | 2,000,000 | Incorporation | Vesting applies | 2,000,000 | 40.00% |
| Founder 2 | Common Stock | 1,500,000 | Incorporation | Vesting applies | 1,500,000 | 30.00% |
| Employee Pool | Option Pool | 750,000 | Plan adoption | Unissued reserve | 750,000 | 15.00% |
| Seed Investor | Preferred Stock | 500,000 | Seed round | 1x liquidation preference | 500,000 | 10.00% |
| SAFE Holder | SAFE | — | Pre-seed | Converts at next round | 250,000* | 5.0%* |
Note: Illustrative only. Replace with actual conversion calculations for your company.
Once the ownership base is set, every financing event – a new round, a SAFE conversion, a new option grant – should be reflected in the cap table immediately. This is the part that trips up most founders managing a table manually in a spreadsheet.
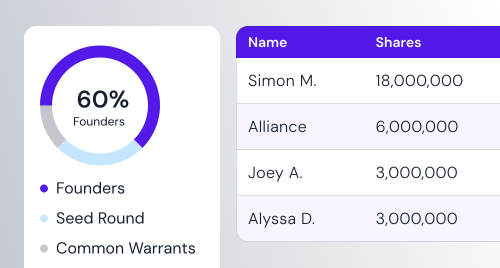
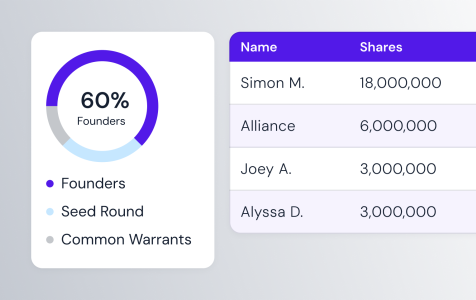
Eqvista’s cap table platform keeps every holder, security type, and ownership percentage on one live dashboard, so the summary and the underlying records can’t drift apart.

Eqvista cap table dashboard showing holders, security types, and ownership percentages
How Waterfall Analysis Works
Once the cap table is in place, waterfall analysis shows how exit proceeds may be distributed. Eqvista describes waterfall analysis as a financial modeling tool used to calculate the amount each shareholder receives upon exit of the company.
The logic is simple:
- Liquidation preferences are paid to preferred shareholders first.
- Preferred holders decide whether to take their preference or convert to common stock, whichever gives them more value.
- Participation rights, if applicable, allow preferred holders to share in remaining proceeds alongside common shareholders.
- Remaining proceeds flow to common shareholders, including founders and employees.
This sequence means a $5M exit and a $25M exit can produce very different outcomes not just in total dollars, but in which shareholder class benefits most relative to their ownership stake.
Waterfall Outcomes at Different Exit Values
The table below shows how exit value affects payouts across share classes. The preference stays fixed at $2M in this example. What changes is how much remains for conversion and common stock as exit value increases.
Payouts by Exit Value
| Exit Value | Preference Paid First | Preferred Payout | Common Payout | Founder Payout | Investor Payout |
|---|---|---|---|---|---|
| $5M | $2,000,000 | $2,000,000 | $3,000,000 | $1,900,000 | $3,100,000 |
| $10M | $2,000,000 | $3,000,000 | $7,000,000 | $4,400,000 | $5,600,000 |
| $25M | $2,000,000 | $7,500,000 | $17,500,000 | $11,000,000 | $14,000,000 |
| $50M | $2,000,000 | $15,000,000 | $35,000,000 | $21,500,000 | $28,500,000 |
Note: This is illustrative only. Actual results depend on the company’s financing terms, liquidation rights, and participation structure.
At lower exit values, the liquidation preference represents a larger share of total proceeds, which means preferred investors recover more relative to common shareholders. At higher exit values, preferred holders are more likely to convert because the as-converted value can exceed the preference.
Running these scenarios in advance helps founders understand the breakeven point – the exit value at which conversion becomes more valuable than taking the preference.
How Eqvista Runs Waterfall Analysis
On Eqvista, founders can run waterfall analysis by entering the exit scenario data at the top of the screen. The top line has boxes for exit scenario inputs, and the key figures for that exit appear below. Eqvista’s waterfall model includes five inputs: exit value, exit date, uncovered debt, transaction fees, and remaining exit value.
See the step-by-step instructions in Eqvista’s waterfall analysis support article.
Once the inputs are confirmed, Eqvista displays the results in two formats: a pie graph and a table. The table can be viewed by securities, by shareholder grant, or by shareholder total. The results can also be downloaded as an Excel sheet from the Download button.

Eqvista waterfall analysis screen showing exit scenario input boxes and key figures
FAQs
Here are a few common questions founders and investors ask during fundraising and exit planning.
What is the difference between a cap table and a waterfall analysis?
A cap table records who owns the company and what securities they hold. A waterfall analysis shows how exit proceeds are distributed based on those ownership rights and liquidation preferences. Both are needed for a complete picture of startup equity.
Who gets paid first in a waterfall analysis?
Preferred shareholders are paid first, up to their liquidation preference amount. After that, they may convert to common stock if doing so gives them a higher payout. Common shareholders including founders and employees receive proceeds from what remains after all preferred claims are settled.
Can waterfall analysis results be downloaded from Eqvista?
Yes. Eqvista says the full results can be downloaded as an Excel sheet, including the payout breakdown by share class and total payout for each class.
How often should a startup update its cap table?
A cap table should be updated after every equity event, new financing rounds, option grants, SAFE conversions, share transfers, or any other ownership change. Keeping the cap table current ensures waterfall analysis and investor reporting are always based on accurate data.
What is a liquidation preference?
A liquidation preference gives preferred shareholders the right to receive a set amount of exit proceeds before common shareholders are paid. A 1x non-participating preference means the investor recovers their investment first. A participating preference means the investor receives their preference and then shares in remaining proceeds alongside common holders.
Why Keeping Cap Tables and Waterfall Analysis in Sync Matters at Eqvista
The cap table and waterfall model only stay accurate when they are updated together. If the cap table reflects a new financing round but the waterfall is still using old preference terms, the exit math will be wrong. If convertible notes have been issued but are not captured in the cap table, the diluted ownership in the waterfall model will be understated.
Eqvista keeps both documents on one platform, removing the manual step where the two quietly fall out of sync, which is exactly what due diligence tends to catch.