Understanding a company’s liquidity is crucial for evaluating its financial health and resilience, especially in times of economic uncertainty. The cash ratio, which compares a company’s most liquid assets to its short-term liabilities, provides a stringent measure of immediate solvency.
Eqvista analyzes the latest cash ratio data across a wide range of industries, as compiled from SEC filings. By highlighting notable trends and industry benchmarks, this analysis offers valuable insights for investors, analysts, and corporate decision-makers seeking to assess liquidity risk and compare financial strategies within and across sectors.

What is Cash Ratio?
The cash ratio is a financial metric that measures a company’s ability to pay off its short-term liabilities using only its most liquid assets—cash and cash equivalents. It is considered the most conservative liquidity ratio, as it excludes other current assets like accounts receivable and inventory, focusing solely on cash and assets that can be quickly converted to cash with minimal risk.
Formula:
Cash Ratio = (Cash + Cash Equivalents) / Current Liabilities
- Cash and cash equivalents include currency, checking accounts, marketable securities, Treasury bills, and other highly liquid investments.
- Current liabilities are obligations due within one year, such as accounts payable, short-term debt, and accrued expenses
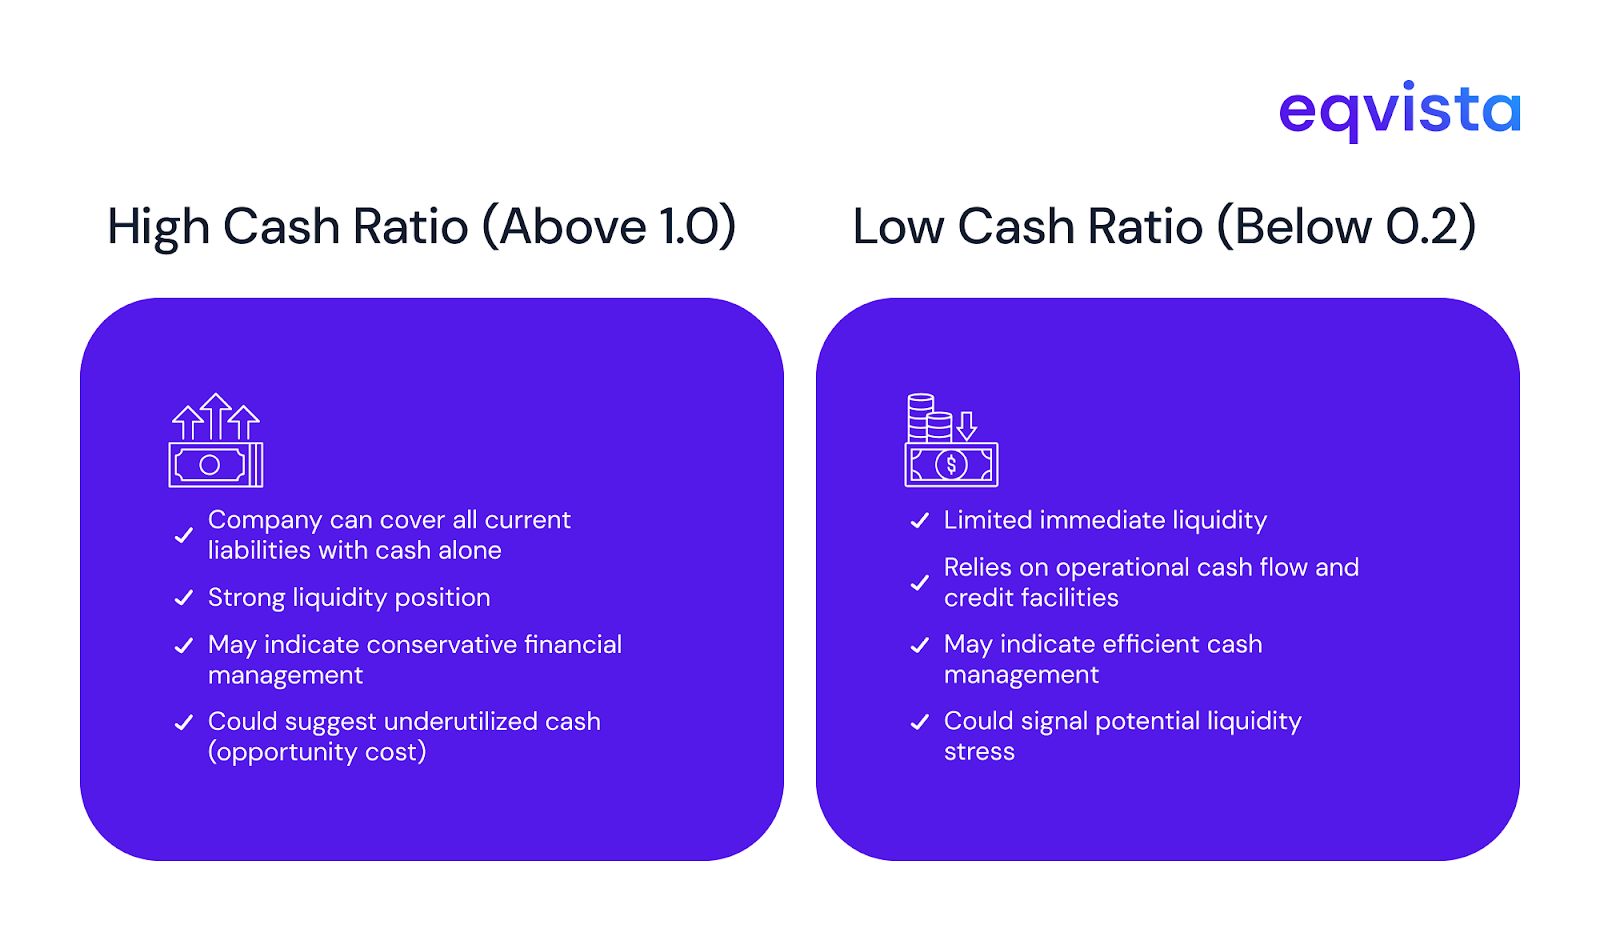
A higher cash ratio (Cash ratio > 1) indicates greater liquidity and a stronger ability to cover immediate obligations. Lower cash ratio (Cash ratio < 1) indicates the company does not have enough cash to cover its short-term liabilities, which may indicate a reliance on other current assets or external financing.
Key Insights from Industry Cash Ratio Analysis
The cash ratio provides a clear, conservative view of a company’s short-term liquidity by focusing exclusively on cash and cash equivalents relative to current liabilities. This analysis can help benchmark a company’s liquidity against its industry peers and understand sector-specific financial strategies.
Companies that leverage these insights effectively will be better positioned to navigate market challenges, capitalize on opportunities, and achieve long-term success in their respective industries.
This industry-wide financial metric transforms individual company liquidity measurements into actionable insights that drive better decision-making, risk management, and strategic planning across entire sectors.
Notable Trends by Industry
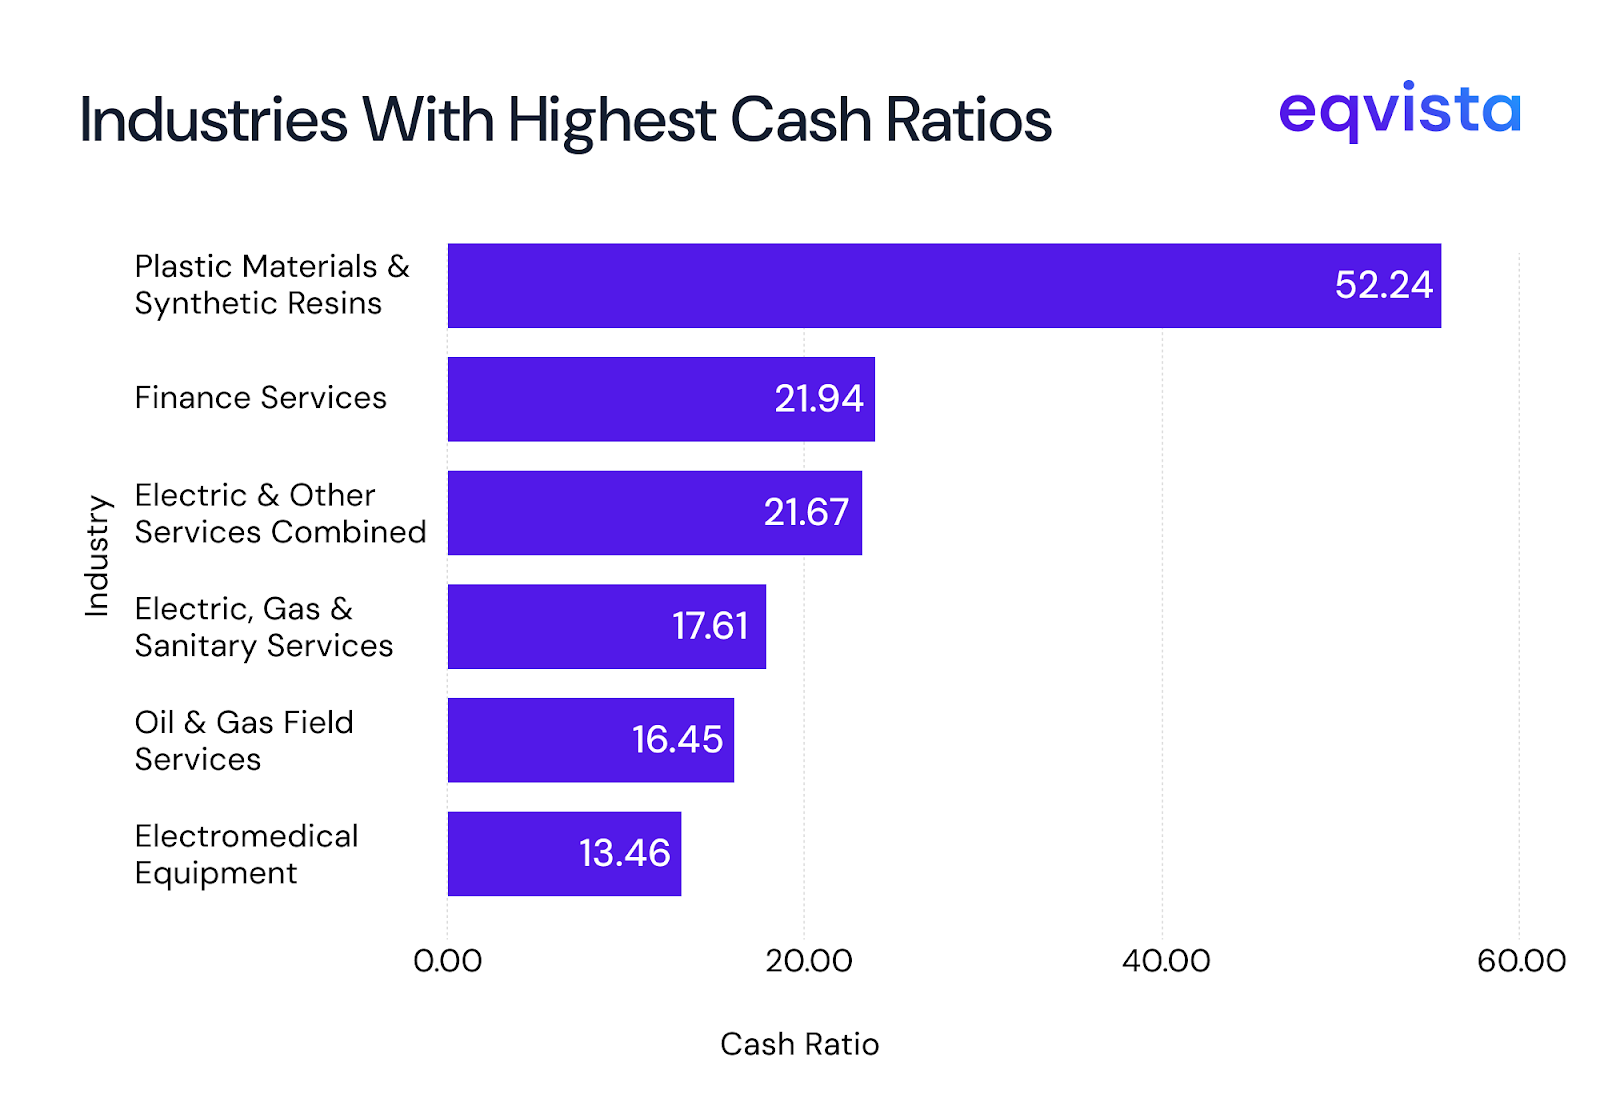
Industries with High Cash Ratios
- Plastic Materials & Synthetic Resins (52.24) – Exceptionally high, likely due to volatile raw material costs and inventory management needs
- Finance Services (21.94) – Expected given the nature of financial intermediation
- Electric & Other Services Combined (21.67) – Utility sector requiring substantial cash for infrastructure and regulatory compliance
- Electric, Gas & Sanitary Services (17.61) – Similar utility sector dynamics
- Oil & Gas Field Services (16.45) – Capital-intensive nature of operations
- Electromedical Equipment (13.46) – Highly regulated industry requiring significant R&D investment and need strong liquidity to fund innovation, manage long product development cycles, and navigate compliance costs.
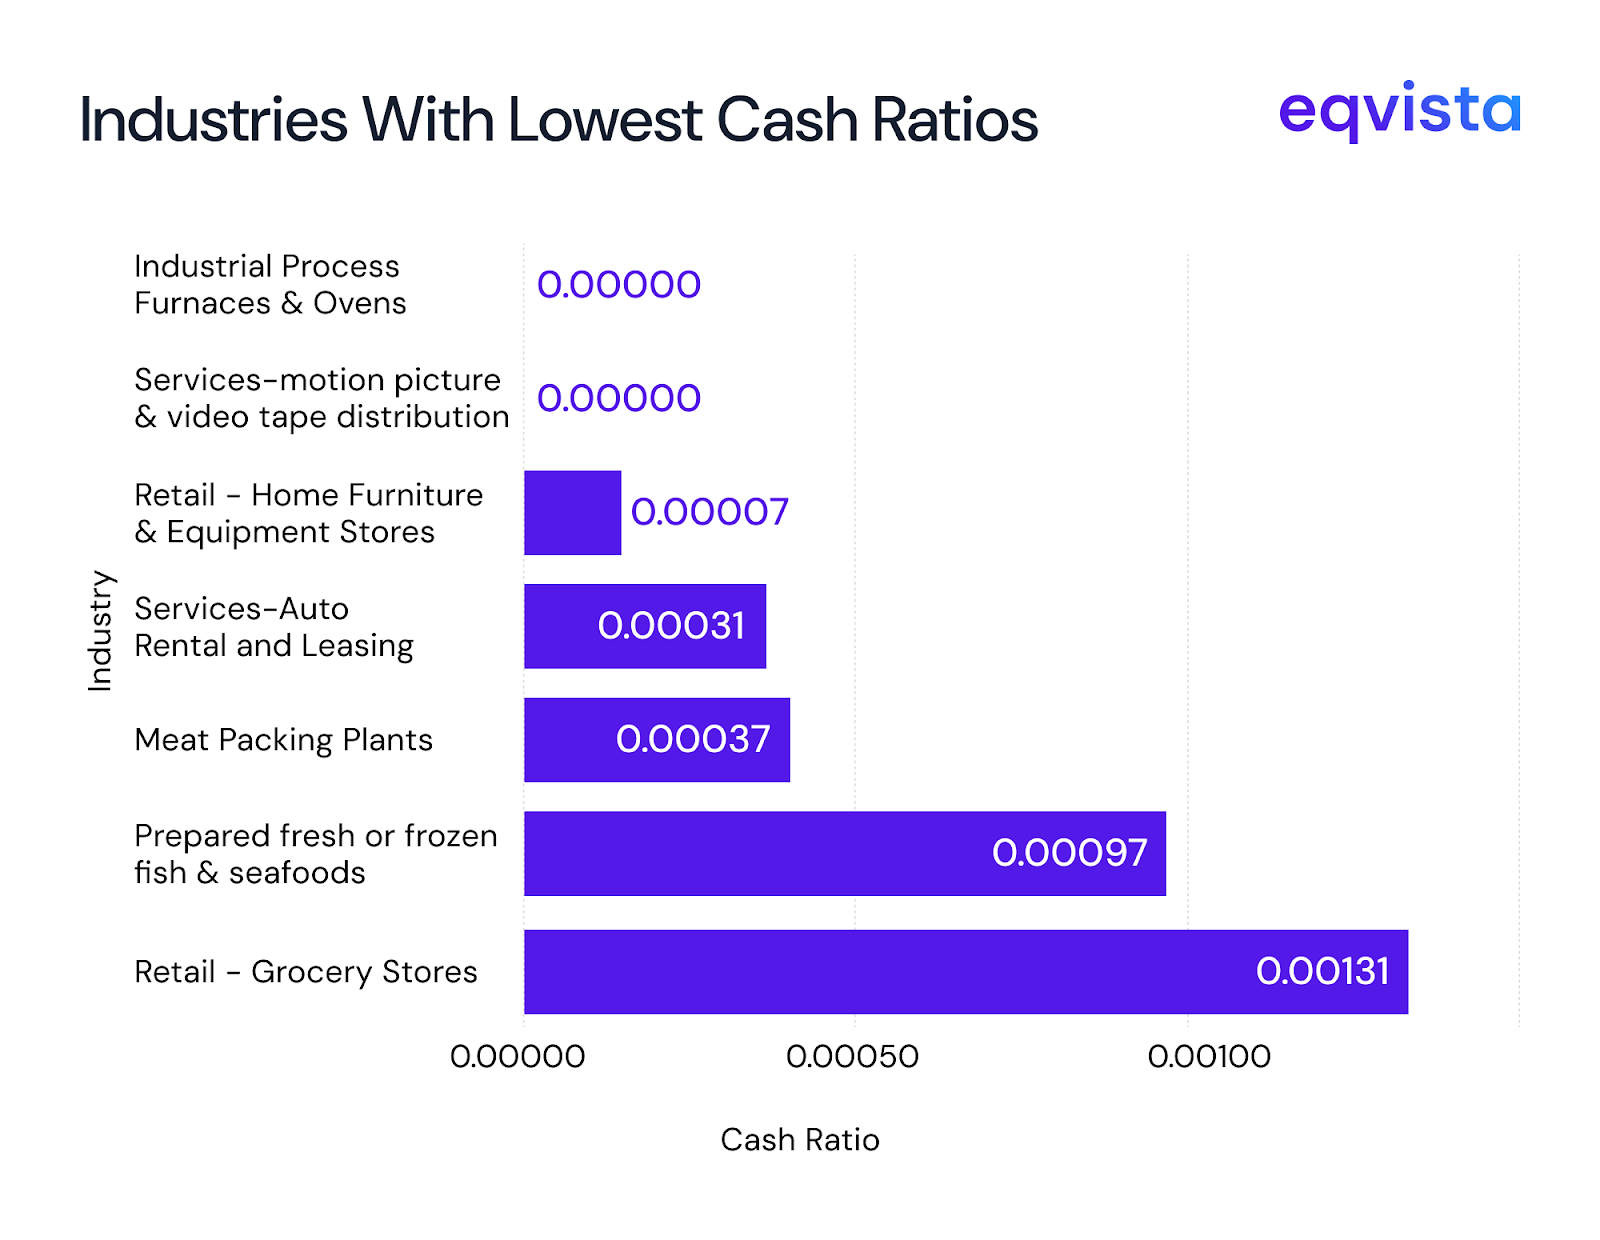
Industries with Low Cash Ratios
- Industrial Process Furnaces & Ovens (0.0) – Specialized manufacturing equipment
- Services-motion picture & video tape distribution (0.0) – Invests heavily in content production and licensing
- Retail – Home Furniture & Equipment Stores (0.00007) – Extremely tight cash management
- Services-Auto Rental and Leasing (0.00031) – Relies heavily on debt to finance vehicle fleets, keeping most assets in cars rather than cash.
- Meat Packing Plants (0.00037) – Food processing with rapid inventory turnover
- Prepared fresh or frozen fish & seafoods (0.00097) – Requires significant investment in inventory, cold storage, transportation, and processing equipment
- Retail – Grocery Stores (0.00131) – Operates on thin margins, maintain high inventory levels, and reinvest heavily in operations, logistics, and supply chain management
High cash ratios are operational necessities rather than inefficiencies, as cash is their primary working asset. Highly variable cash ratios reflecting different aspects of the energy value chain – exploration and services require more cash reserves than distribution.
Traditional manufacturing industries show relatively low cash ratios, indicating efficient working capital management and established supplier relationships.
Additional Insights
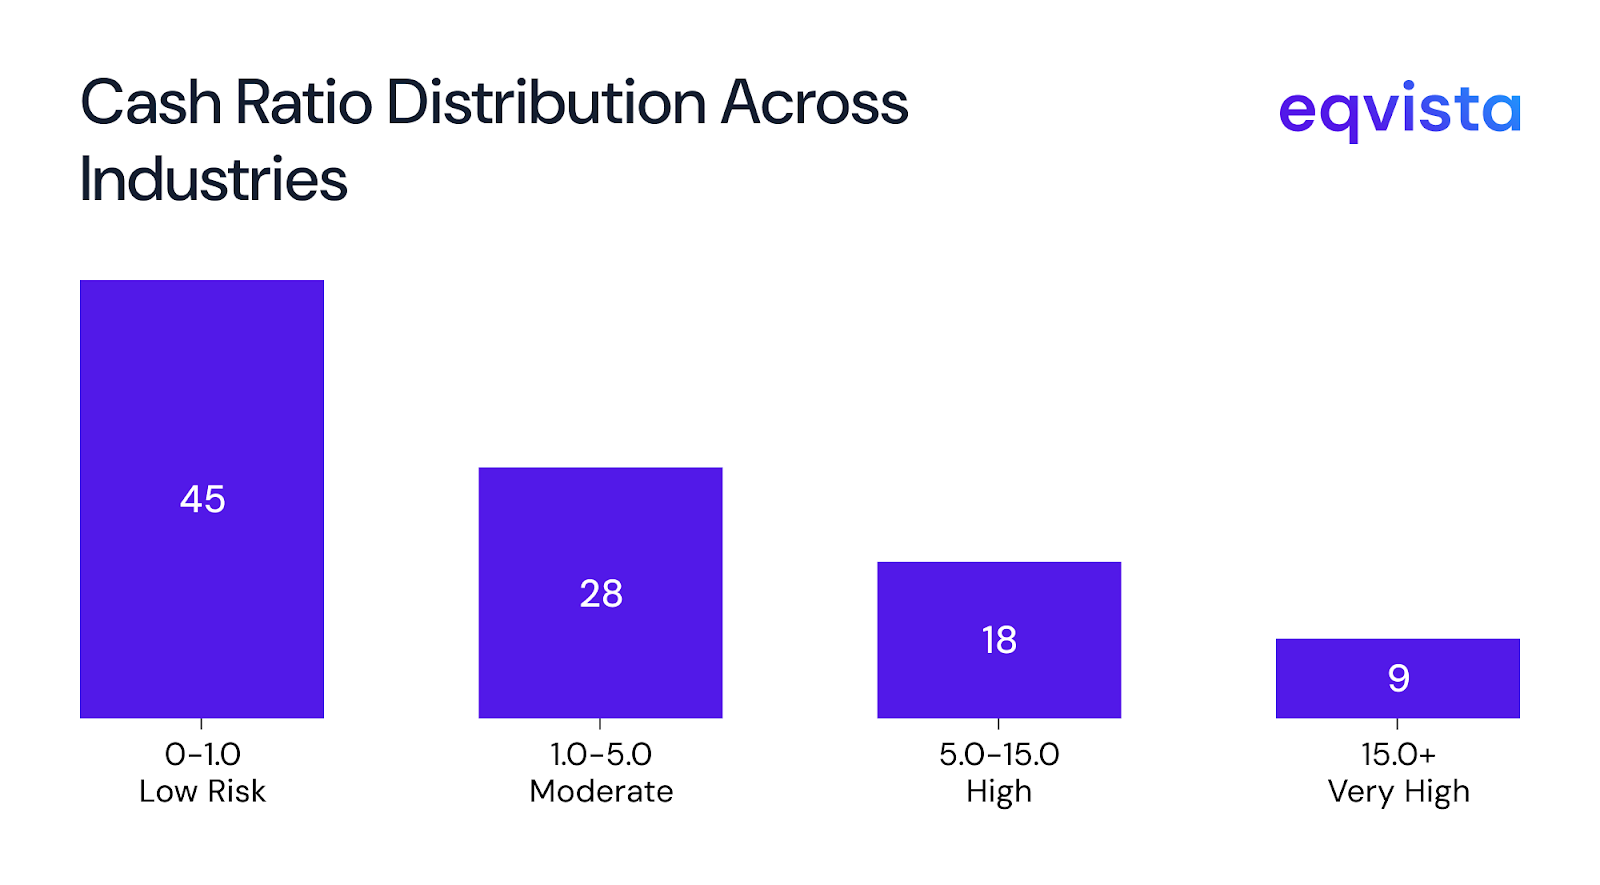
The “Goldilocks Zone” – Industries with cash ratios between 1-5 might represent the sweet spot for investment opportunities. They have enough reserves to weather storms but aren’t sitting on excessive cash that could indicate lack of profitable investment opportunities.
- The Supplier Finance Story – Those ultra-low ratios tell a fascinating story about market power. When grocery stores operate with a 0.00131 cash ratio, they’re essentially running their entire business on supplier credit. This reveals who really has the power in various supply chains.
- Hidden Cyclicality Markers – Industries maintaining high cash reserves despite appearing stable (like membership sports clubs at 10.34) might actually be more cyclical than they appear. That cash cushion suggests they experience significant seasonal or economic swings.
- Innovation Tax – There’s almost an “innovation tax” visible in the data. Industries doing cutting-edge work consistently carry higher cash ratios, essentially paying a premium for uncertainty and long development cycles.
- Geographic Constraints – Some of these extreme ratios likely reflect industries tied to specific locations or resources, where companies can’t easily pivot or diversify their operations geographically.
Eqvista: Empowering Smarter Financial Decisions!
In conclusion, analyzing the cash ratio across industries provides valuable insight into how companies manage liquidity and prepare for both opportunities and risks unique to their sectors. Understanding these differences helps stakeholders benchmark performance, identify potential red flags, and make informed decisions about financial health and strategy.
For businesses and investors seeking to optimize their financial management or evaluate industry peers, leveraging advanced tools like Eqvista can streamline the process of tracking, analyzing, and comparing key liquidity metrics.
Discover how Eqvista’s comprehensive platform can empower your financial decision-making and help you stay ahead in today’s dynamic market. Contact Us today!


