Last Updated: May, 2026
A company’s ability to address its short-term financial commitments depends on how well it manages the resources available to its immediate debts. This balance is evaluated using a financial metric that compares current assets to current liabilities. This offers insight into the firm’s liquidity and operational efficiency.
Understanding this metric helps businesses anticipate potential cash flow challenges and make informed decisions. In this article, we have added a complete list of working capital ratios and insights.

What is the Working Capital Ratio?
The working capital ratio is also called the current ratio. Investors rely on this ratio to evaluate creditworthiness and financial stability. It is calculated using the formula:
Working Capital Ratio = Current Assets/Current Liabilities
- Current assets include cash, inventory, accounts receivable, and short-term investments.
- Current liabilities include debts and obligations such as accounts payable and short-term loans that are due within one year.
What is Working Capital?
Working capital is the difference between a company’s current assets and current liabilities. It represents the amount of money a business has available to support its short-term operations and obligations.
Working Capital = Current Assets – Current Liabilities
Working Capital Ratio: A Key Indicator of Financial Liquidity Health
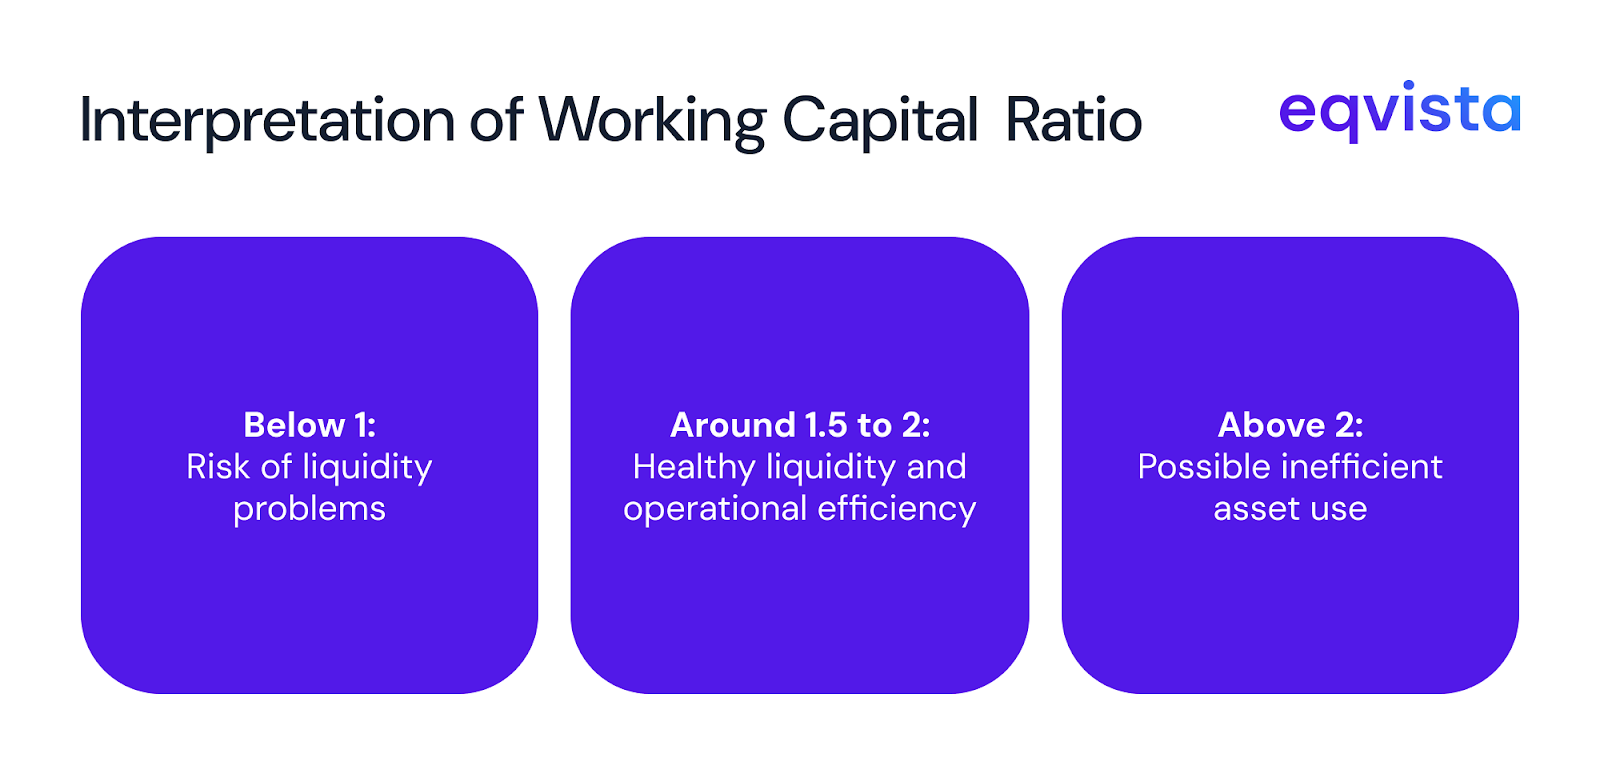
Current ratio indicates whether a company has enough short-term assets to cover its short-term liabilities.
Working Capital Ratio Below 1
| Industry | Average current ratio |
|---|---|
| Airlines | 0.57 |
| Lodging | 0.72 |
| Personal Services | 0.8 |
| Utilities - Regulated Electric | 0.84 |
| Resorts & Casinos | 0.85 |
| Utilities - Renewable | 0.89 |
| Travel Services | 0.87 |
| Oil & Gas E&P | 0.86 |
| REIT - Specialty | 0.96 |
| Utilities - Regulated Gas | 0.86 |
| Medical Distribution | 0.91 |
| Utilities - Regulated Water | 0.97 |
| Utilities - Diversified | 0.98 |
Working capital Ratio between 1 and 1.5
| Industry | Average current ratio |
|---|---|
| Entertainment | 1.05 |
| Publishing | 1.06 |
| Oil & Gas Integrated | 1.06 |
| Auto Manufacturers | 1.21 |
| Restaurants | 1.09 |
| Oil & Gas Midstream | 1.09 |
| Discount Stores | 1.18 |
| Oil & Gas Refining & Marketing | 1.2 |
| Advertising Agencies | 1.2 |
| Auto & Truck Dealerships | 1.23 |
| Healthcare Plans | 1.25 |
| Railroads | 1.31 |
| Trucking | 1.33 |
| Waste Management | 1.33 |
| Grocery Stores | 1.33 |
| Home Improvement Retail | 1.34 |
| Electronic Gaming & Multimedia | 1.36 |
| Gambling | 1.4 |
| Telecom Services | 1.31 |
| Integrated Freight & Logistics | 1.37 |
| Medical Care Facilities | 1.41 |
| Specialty Retail | 1.38 |
| Packaging & Containers | 1.42 |
| Financial Data & Stock Exchanges | 1.44 |
| Engineering & Construction | 1.45 |
| Insurance Brokers | 1.49 |
| Specialty Business Services | 1.49 |
| Drug Manufacturers - General | 1.49 |
Working capital Ratio between 1.5 and 2
| Industry | Average current ratio |
|---|---|
| Internet Retail | 1.55 |
| Real Estate Services | 1.53 |
| Broadcasting | 1.53 |
| Apparel Retail | 1.57 |
| Tobacco | 1.64 |
| Electronics & Computer Distribution | 1.62 |
| Rental & Leasing Services | 1.61 |
| Food Distribution | 1.62 |
| Leisure | 1.61 |
| Consulting Services | 1.59 |
| Oil & Gas Drilling | 1.66 |
| Software - Infrastructure | 1.76 |
| Education & Training Services | 1.7 |
| Farm Products | 1.75 |
| Solar | 1.73 |
| Luxury Goods | 1.72 |
| Beverages - Wineries & Distilleries | 1.88 |
| Information Technology Services | 1.78 |
| Staffing & Employment Services | 1.58 |
| Household & Personal Products | 1.8 |
| Recreational Vehicles | 1.76 |
| Capital Markets | 1.8 |
| Aluminum | 1.91 |
| Conglomerates | 1.84 |
| Packaged Foods | 1.9 |
| Auto Parts | 1.89 |
| Beverages - Non-Alcoholic | 1.98 |
| Farm & Heavy Construction Machinery | 1.95 |
| Building Products & Equipment | 1.99 |
| Oil & Gas Equipment & Services | 2 |
| Thermal Coal | 1.87 |
Working capital Ratio above 2
| Industry | Average current ratio |
|---|---|
| Consumer Electronics | 2.01 |
| Agricultural Inputs | 2.13 |
| Software - Application | 2.05 |
| Computer Hardware | 2.12 |
| Specialty Industrial Machinery | 2.09 |
| Footwear & Accessories | 2.1 |
| Marine Shipping | 2.12 |
| Apparel Manufacturing | 2.11 |
| Paper & Paper Products | 2.14 |
| Furnishings, Fixtures & Appliances | 2.18 |
| Electrical Equipment & Parts | 2.18 |
| Other Industrial Metals & Mining | 2.21 |
| Internet Content & Information | 2.06 |
| Communication Equipment | 2.39 |
| Gold | 2.46 |
| Specialty Chemicals | 2.33 |
| Security & Protection Services | 2.21 |
| Tools & Accessories | 2.42 |
| Building Materials | 2.43 |
| Chemicals | 2.46 |
| Industrial Distribution | 2.52 |
| Pollution & Treatment Controls | 2.3 |
| Electronic Components | 2.65 |
| Metal Fabrication | 2.37 |
| Credit Services | 2.47 |
| Aerospace & Defense | 2.59 |
| Health Information Services | 2.71 |
| Steel | 2.7 |
| Residential Construction | 2.78 |
| Scientific & Technical Instruments | 2.68 |
| Asset Management | 2.92 |
| Drug Manufacturers - Specialty & Generic | 2.69 |
| Semiconductors | 2.92 |
| Coking Coal | 2.87 |
| Diagnostics & Research | 3.13 |
| Other Precious Metals & Mining | 3.47 |
| Medical Instruments & Supplies | 3.62 |
| Copper | 3.58 |
| Semiconductor Equipment & Materials | 3.67 |
| Medical Devices | 4.06 |
| Biotechnology | 5.5 |
Key to Business Liquidity and Financial Health with Eqvista
Understanding the current ratio is crucial for managing a company’s liquidity. Accurate analysis not only gives business’s ability to meet short-term obligations but also plays a vital role in company valuation and long-term financial planning.
Eqvista offers tools that are beneficial for businesses aiming to optimize their financial management. The platform’s features, such as real-time analytics, financial modeling, and compliance support, streamline equity and management for startups and established companies.
Try Eqvista today and experience efficient, data-driven business management.