Volatility Calculation Of ASC 718 Report
The section under ASC 718 considers the volatility of similar companies for comparison. The variability or fluctuations in the stock price over a certain time are measured by the volatility.
Note: the ASC 718 feature is only available for 409A account holders. Kindly upgrade your account to unlock this feature.
To understand the downloaded ASC 718 report, you must first create a form. Check out our support guide to learn how to create an ASC 718 report on Eqvista.
ASC 718 report – Volatility calculation
The section provides volatility calculation and peer group comparison by comparing the volatility of stocks of similar companies.
Here are the steps to follow:
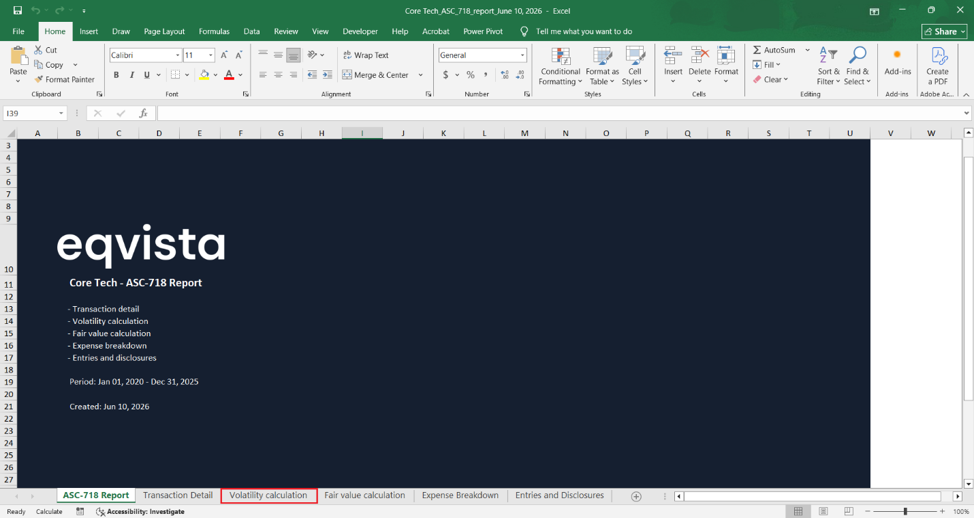
Step 1: Double-click the file to open the ASC 718 report in Excel format that was downloaded. At the bottom of the page, you will see the different sections of the report. Here, click the tab “Volatility Calculation”.
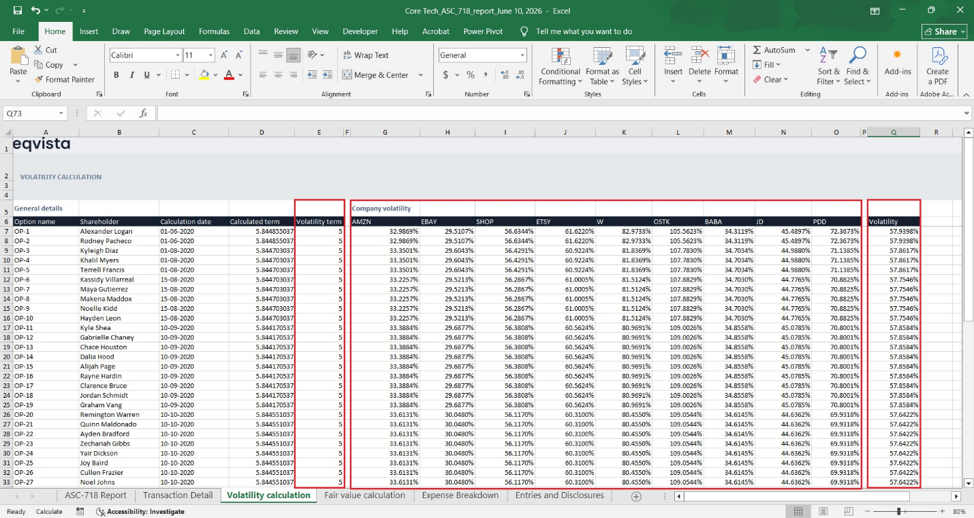
Step 2: The section calculates the volatility of similar companies by taking into account the volatility term (time period), applying daily average standard deviation over the term, and arriving at the total volatility calculated.
Volatility calculations formula
To calculate volatility, we take the formula:


The number of trading days in a year is assumed to be 252 for stocks.
The total number of years and trading days is calculated over the volatility term.
After calculating the volatility of similar companies taken for comparison, the average is calculated.
There are four more sections, apart from the one discussed above: Entries and Disclosures, Transaction Detail, Fair value calculation, and Expense Breakdown.
To get started, contact us right now to learn more information about Eqvista’s other features and also check out our support articles and knowledge base.
