Market Cap Guide for Investors
In this article, we will explore how a company’s market cap can not only help assess a company’s size but also its financial performance.
When you are comparing two companies, you may mistakenly assume that the company with the higher share price is the larger one. For instance, if you look at Ecopetrol’s share price of $9.67 and compare it with Walmart which has a share price of $101.15, you would assume that Walmart is the larger company. However, Ecopetrol’s value, or rather its market cap, is more than double that of Walmart.
Thus, over-reliance on share prices can lead to incorrect conclusions. Hence, investors must learn about other metrics such as market cap.
In this article, we will explore how a company’s market cap can not only help assess a company’s size but also its financial performance in comparison to how it is being valued by the stock market. Read on to know more!
What is Market Capitalization?
Market capitalization, also known as market cap, is a measure of how the stock market decides to value a public company. It is calculated using the following formula:
Market capitalization = Number of outstanding shares × Current market price
A company’s current market price is set by the forces of demand and supply while its number of outstanding shares are simply the total number of shares it has issued. For instance, Amazon has 10.6 billion outstanding shares and its share price was $229.15. So, we can calculate Amazon’s market cap as follows.
Amazon’s market cap = $229.15 × 10,600,000,000 = $2,428,990,000,000
So, we can see that Amazon’s market cap is approximately $2.43 trillion.
What are the different types of market capitalization?
Total and free-float market cap are the two types of market cap. So far, we have discussed the total market cap, which considers a company’s total outstanding shares. However, this includes closely held shares owned by company insiders and controlling investors, which are seldom traded on the stock exchange. When we exclude these closely held shares from a company’s total outstanding shares, we get its floating stock, which is used to calculate the free-float market cap.
The formula for the free-float market cap is as follows.
Free-float market cap = Floating stock × Current market price
Amazon has 9.39 billion floating shares so its free-float market cap can be calculated as follows.
Amazon’s free-float market cap = $229.15 × 9,390,000,000 = $2,151,718,500,000
Thus, while Amazon’s market cap is $2.43 trillion, its free-float market cap is $2.15 trillion

How is enterprise value different from market cap?
Enterprise value (EV) and market cap both help investors understand the value of a company, however, these terms are not synonymous. While market capitalization only measures a portion of a company’s equity, enterprise value is a more comprehensive metric that also considers its debt and cash holdings. You can calculate enterprise value using the following formula.
Enterprise value (EV) = Market cap+Value of other equity issued+Debt-Cash holdings
By looking at a company’s EV, you can understand how the market is valuing its assets.
Just like market cap, enterprise value is also used to understand if a company is being fairly valued or not. A commonly used EV valuation multiple is EV/EBITDA (earnings before interest tax, depreciation, and amortization) which provides more accurate results than market cap-based multiples when comparing companies with differing capital structures.
How are stocks categorized by their market capitalization?
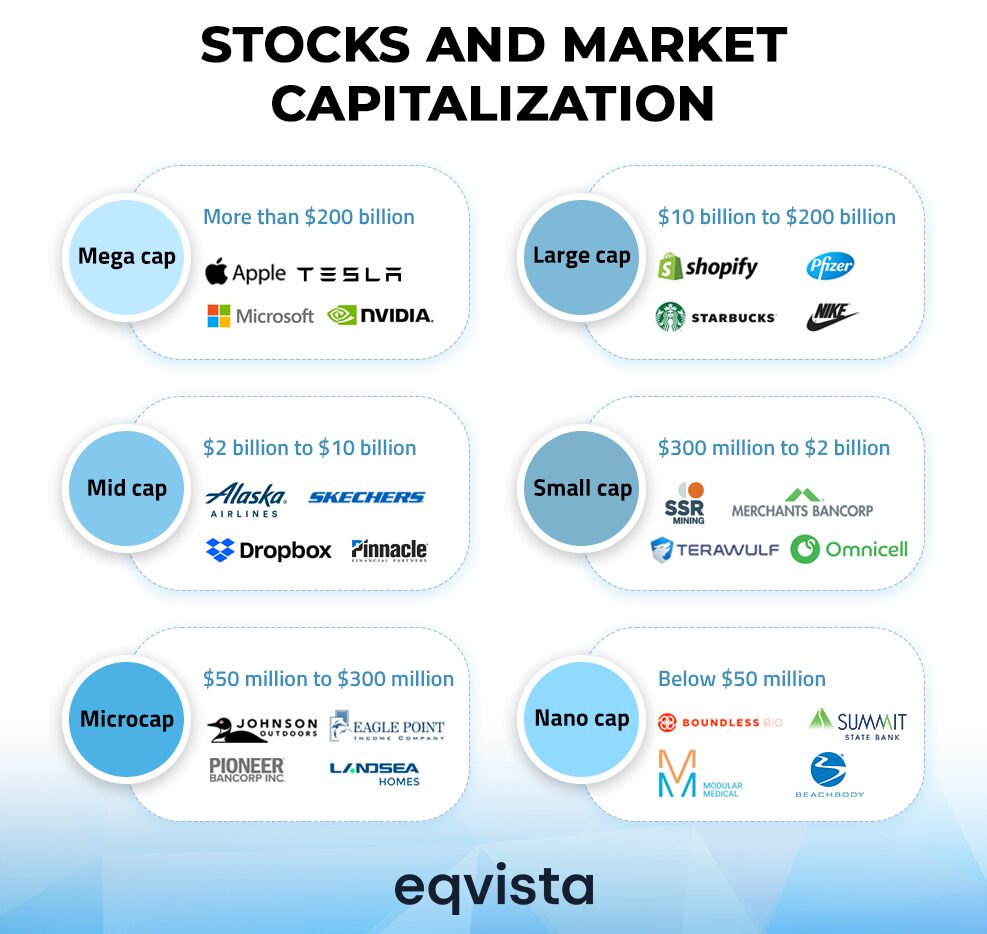
In the United States, we can categorize companies as per their market capitalization into five groups which are as follows.

Note: A company may move between market cap categories over time as its stock price changes.
Conventional investing wisdom suggests that companies with smaller market caps are riskier than larger companies while large-cap companies have less growth potential. However, you must note that a company’s market cap is not the only factor determining risk levels and growth potential. For instance, NVIDIA was already a large-cap company five years ago yet it has grown by nearly 2,000% since then.

How should investors use market capitalization to evaluate stock performance?
A company’s market cap can help investors evaluate a stock’s volatility. Market cap is also a more accurate representation of a company’s performance than stock price history. Let us discuss these concepts in more detail.
Understanding volatility through free-float market cap
When a company’s free float market cap is significantly lower than its total market cap, its stock price is influenced by trading activity within a relatively small portion of its total outstanding shares. In such situations, low trading volumes can lead to higher price volatility, as even the smallest spikes in buying or selling pressure can cause disproportionate price changes.
Thus, when the free-float market cap is significantly lower than the total market cap, a stock is considered highly volatile.
Conversely, a stock will be less volatile if its free-float market cap is close to its total market cap.
Accurately measuring a company’s performance
Most stock market newcomers focus more on a company’s stock price than its market capitalization. While this may not be an issue for assessing short-term performance, it can lead to a distorted view of the company’s long-term growth. A company’s total outstanding shares can fluctuate due to stock splits, bonus issues, new share issuances, conversions of convertible securities, and employee stock option exercises.
Therefore, over the long term, instead of solely tracking stock prices, investors should focus on market capitalization to get a more accurate picture of a company’s true value and performance.
Market cap-based performance metrics
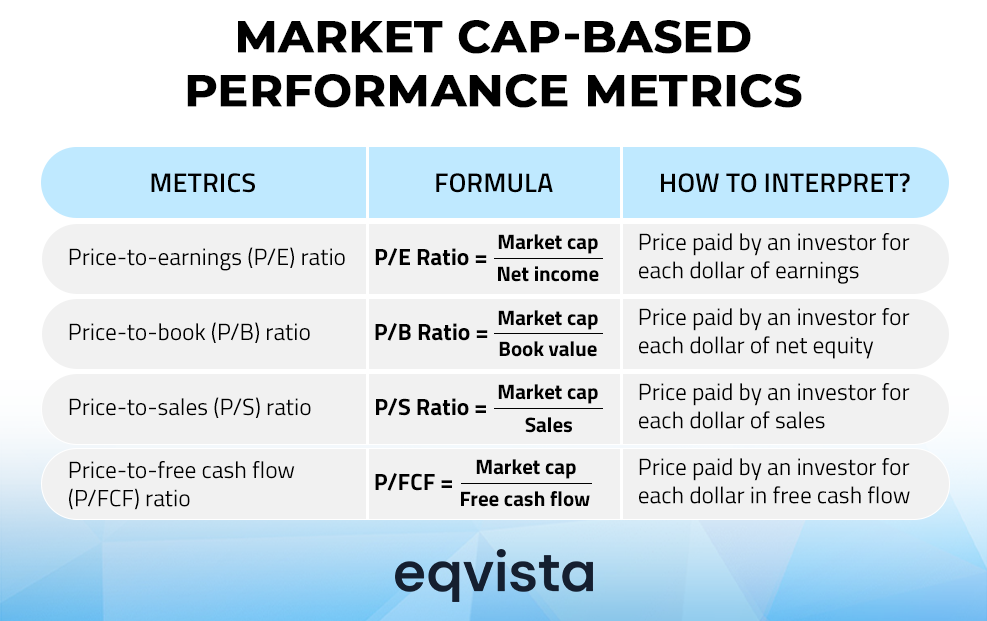
Market capitalization is commonly used as a component of various valuation multiples some of which are listed as follows.

Note: Annual financial figures are used to calculate these valuation multiples.
The purpose of price multiples is to assess whether a company is undervalued, overvalued, or fairly valued. A high price multiple indicates overvaluation, suggesting high growth expectations, while a low price multiple indicates undervaluation, suggesting that either the market is underestimating the company or there are some known underlying risks that have not yet been reflected in the financial statements.
With any investment opportunity, understanding which price multiple is fair is a central theme. Such an assessment requires research and analysis aimed at understanding a company’s growth potential and expected longevity by studying its financial history, industry trends, and economic conditions.
Eqvista – Accurate valuations for informed decisions!
Market cap enables investors to get a more comprehensive view of a company’s value and its stock market performance, especially if the company goes for stock splits, bonuses, converts convertible debt, or offers stock options to employees. The market cap also forms the basis for categorizing companies based on size.
You can also apply market cap to understand if a stock is volatile or overvalued.
To get an even more comprehensive view whose accuracy is not affected by capital structures, you can use the market cap to calculate enterprise value.
While the various data aggregation websites publish market caps for public companies, it can be much more challenging to find the fair value of a private company. If you are an investor struggling to understand a private company’s value, allow Eqvista to be of assistance. Our team of seasoned valuation analysts has valued more than 19,000 companies across sectors and stages. Contact us to know more!
Interested in issuing & managing shares?
If you want to start issuing and managing shares, Try out our Eqvista App, it is free and all online!