Startup Valuation Dashboard
In the business world, knowing the value of your startup is important. There are many valuation methods to determine your company’s value, but Eqvista has developed startup valuation software.
After you have filled up the payment details and placed an order for startup valuation, you can find valuation data and methods breakdown in the dashboard.
Here are the steps to follow:
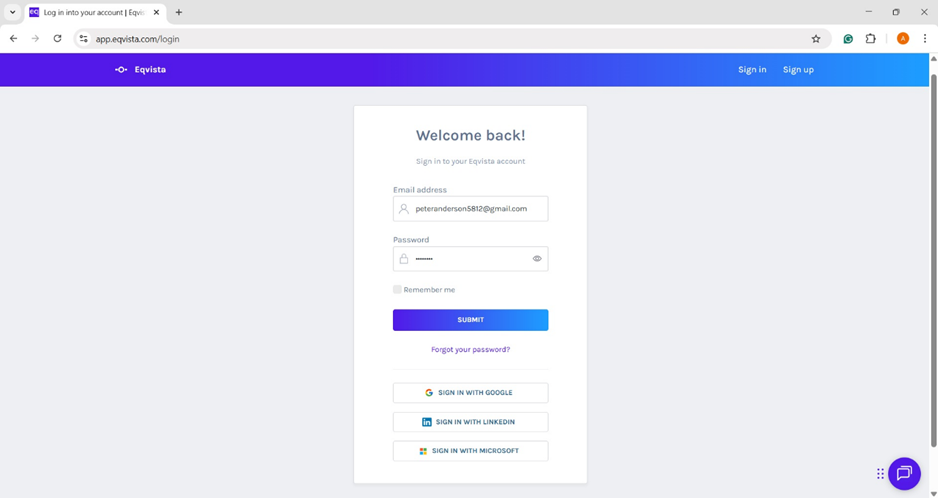
Step 1: Log into your Eqvista account and select the company account.
On the dashboard, click on “Startup Valuation” on the left-hand side to get a drop-down menu and click on “Dashboard”.
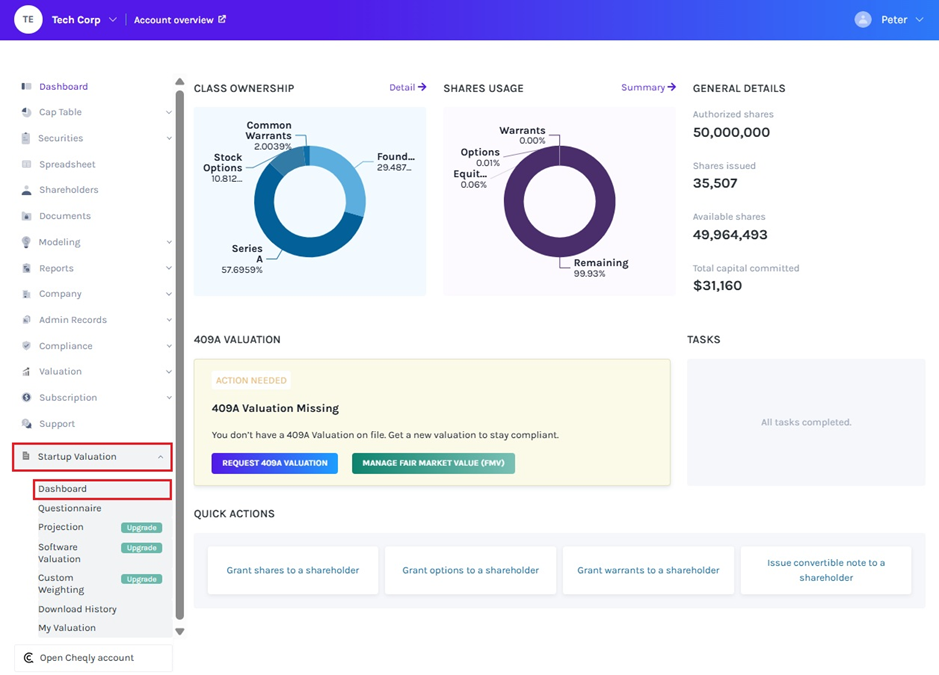
Once you click, it will show the dashboard with pre-money valuation and detailed valuation. On this page, you will find valuation data and methods breakdown.
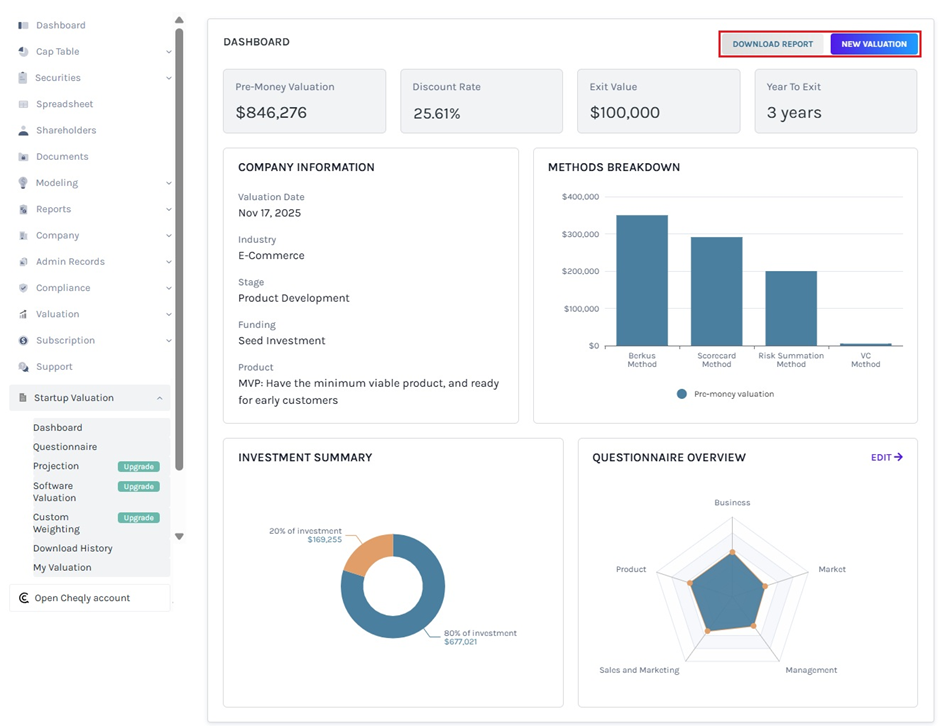
Scenario 1 – Valuation Dashboard For Basic Plan
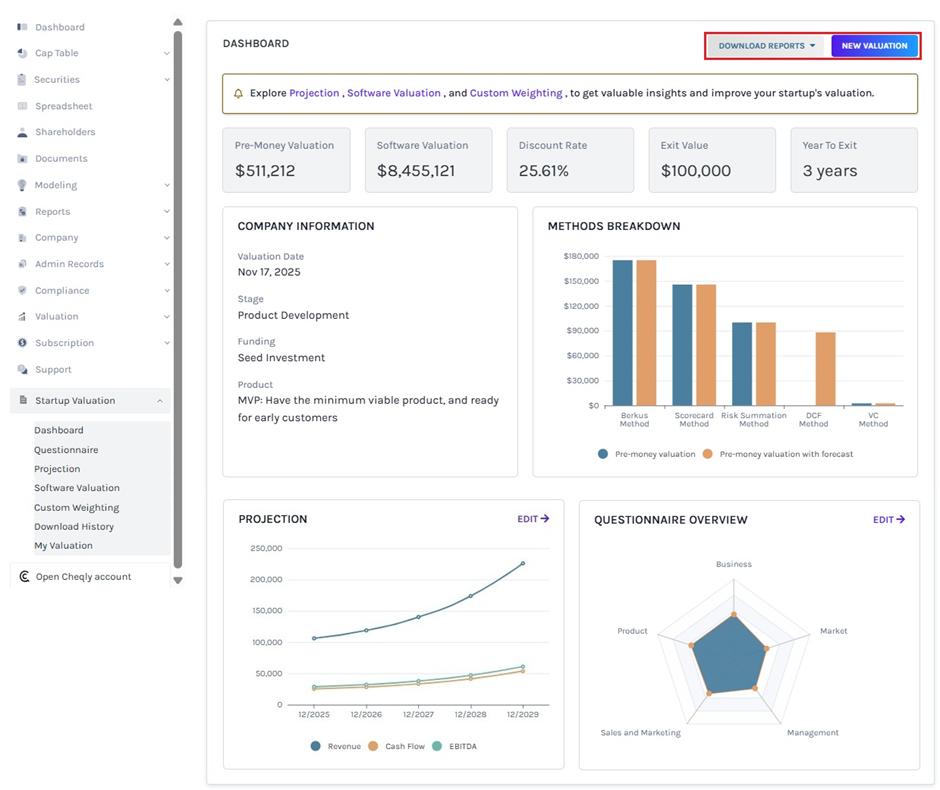
Scenario 2 – Valuation Dashboard For Growth Plan
The dashboard has two options at the top of the page:
- To download the valuation reports, you would have to click “Download Report” at the top right of the page.
- For a new valuation report, click “New Valuation” to place an order for startup valuation.
A detailed feature-by-feature analysis of the dashboard will help you understand it better.
Panel 1
Pre-money valuation is the estimated value of a company before receiving funds from investors.
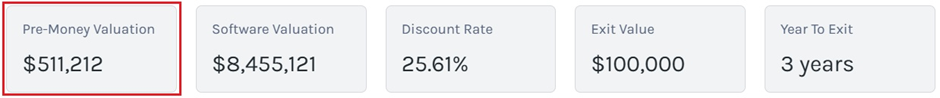
Custom Weighting can be used to try different weight combinations to see the impact on the pre-money valuation. The feature is only available for “Growth” plan holders and kindly upgrade your plan.
Panel 2
The next section of the dashboard provides “Software Valuation” on the top left side of the page.
Note: The software valuation is only available for “Growth” plan holders. Kindly upgrade your plan to unlock this feature.
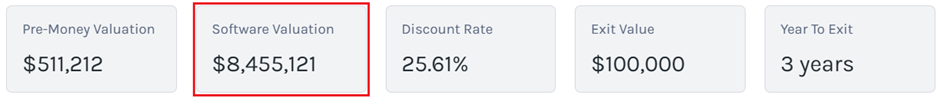
Software Valuation is estimating the value based on the cost of producing and distributing the software.
Panel 3
Moving to the next section of the dashboard, it provides the “Discount Rate” on the top centre of the page.
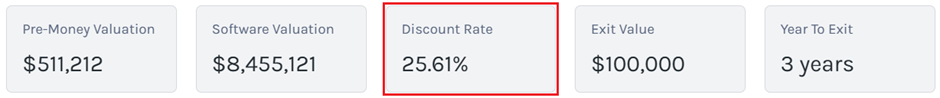
The discount rate is the rate of return used to convert future cash flow from the company to present value using discounted cash flow.
Panel 4
In the next section to the top of the page, you will be able to see the “Exit Value”.
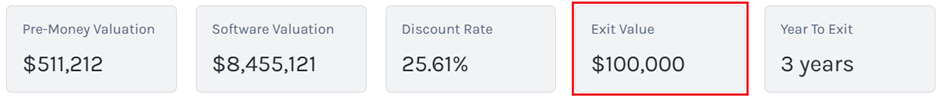
The Exit Value is the value the company can be sold. The value is determined by factors such as the size of the company, revenue, growth rate, and market conditions.
Panel 5
The next section to the top right side of the page displays the “Year to Exit”.
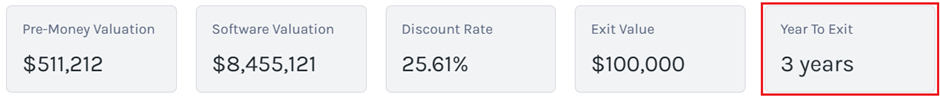
The timeline for a startup to exit or go public. The average time to exit through an acquisition can vary for startups.
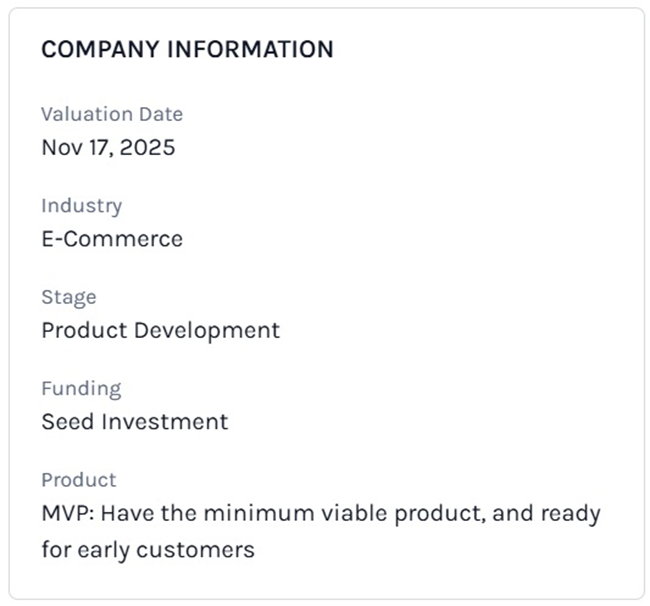
Panel 6
Below the above panels discussed, you will see “Company Information”. It provides details of the company including the valuation date, industry, stage of the company, funding, and product development stage.
Panel 7
The next section is a graphical representation of the valuation methods titled “Methods Breakdown”.
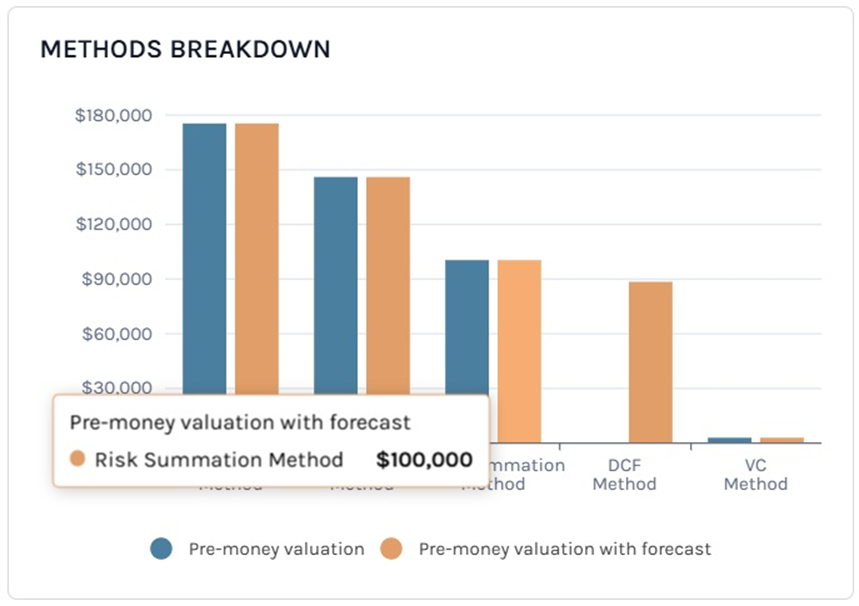
There are many valuation methods to determine your company’s value, but Eqvista makes use of 5 valuation methods:
- Scorecard Method – The method analyses businesses based on factors that have an impact on a company’s value. It helps angel investors determine a valuation for startups that have the potential to expand.
- Risk Factor –The method is a rough pre-money valuation method. It bases the company’s valuation on a comparable startup’s base value, and this baseline value is then modified for a total of 12 risk variables.
- Berkus Method – The Berkus Approach evaluates a startup based on five main success factors. It analyses how much value the criteria provide to the enterprise’s total worth in quantitative terms.
- VC Method –The ideal solution for startups yet to generate revenue. The method can be used to value early-stage and pre-revenue enterprises.
- DCF Method – The method uses predicted future cash flows to determine the value. It calculates the current value of an asset based on future forecasts of how much money will be generated. The method considers inflation when calculating the present value of the company.
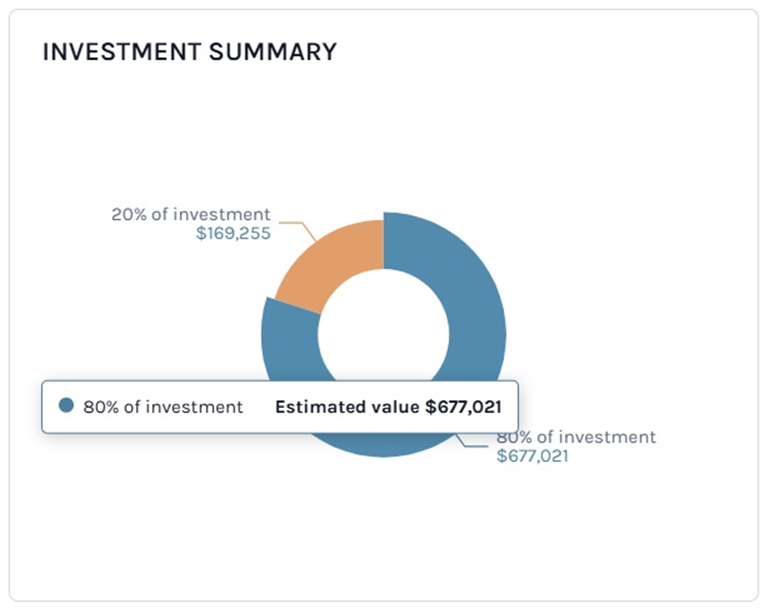
Panel 8
The next section is a graphical representation of the “Investment Summary”. The graph displays the percentage and investment amount.
The section of the dashboard also provides a graphical representation of “Projection”. It is a tool for gaining insights into a company’s financial performance to make informed business decisions, plan for growth, and stay ahead of the competition. When clicked, the graph shows the projection value for the particular time period.
Note: The projection is only available for “Growth” plan holders. Kindly upgrade your plan to unlock this feature.
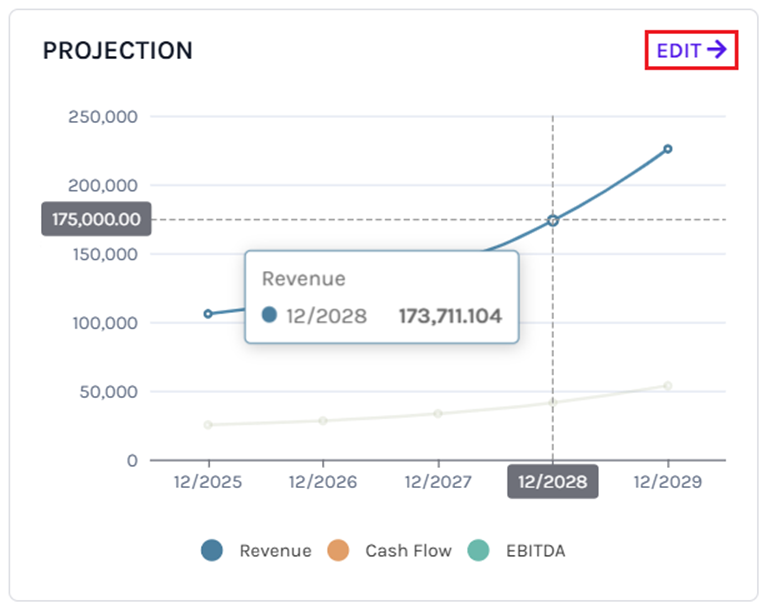
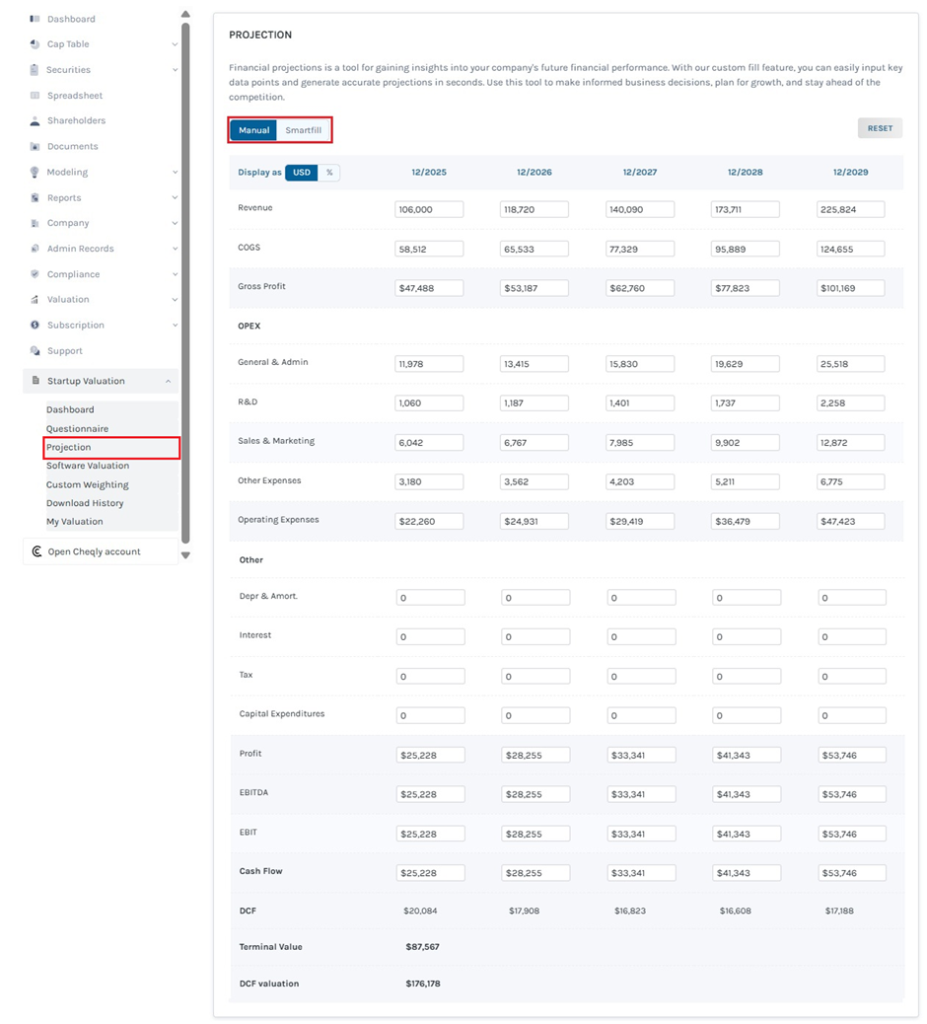
There is an option above the graph that says, “Edit →”. By clicking on this, you will reach the page that shows the values to edit it as shown below. You can fill the values either Manually or using the Smartfill option.
Panel 9
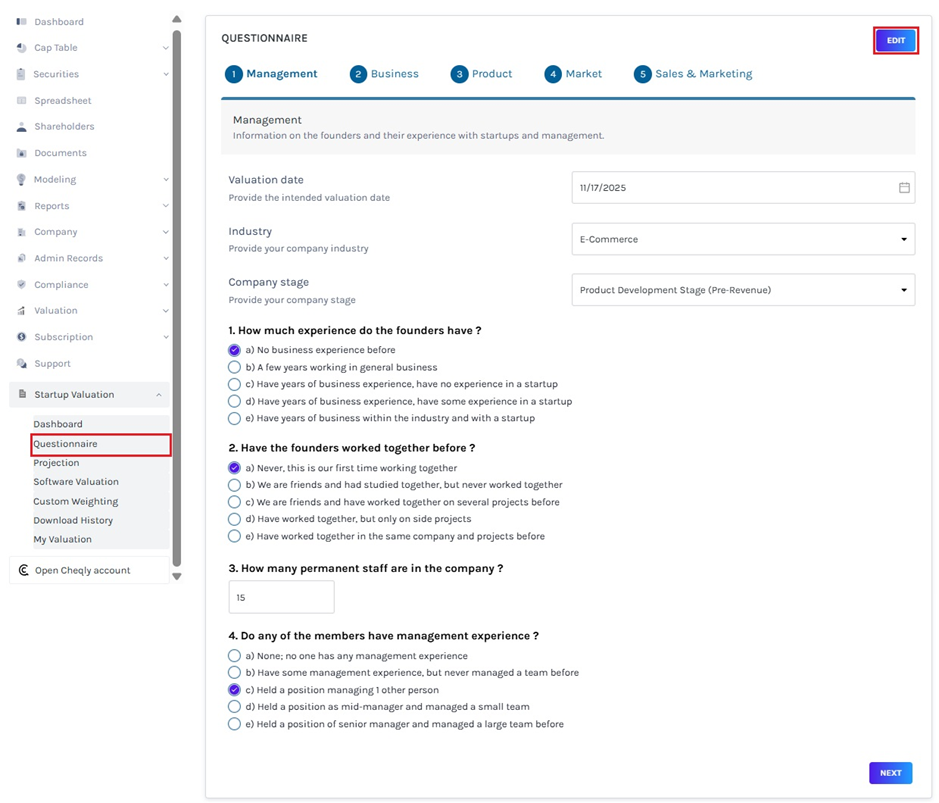
The last section is dedicated to “Questionnaire Overview”. It is a graphical representation of the 5 categories covered in the questionnaire – Management, Business, Product, Market, and Sales and Marketing.

There is an option above the graph that says, “Edit →”. By clicking on this, you will reach the page that shows the questionnaire to edit the answers as shown below.
For more information on Eqvista’s other processes, check out our support articles or contact us today!
