Filling Out Projection Manually
After you have placed the order for valuation, you can fill out the valuation questionnaire. Then, a summarized startup valuation report will be prepared and available for download.
Further, projections can be used to gain insights into a company’s financial performance, which can help it plan for growth, make better business decisions, and overcome the competition.
Note: The projection is only available for “Growth” plan holders. Kindly upgrade your plan to unlock this feature.
Create Projection
Here are the steps to follow:
Step 1: Log into your Eqvista account and select the company account.
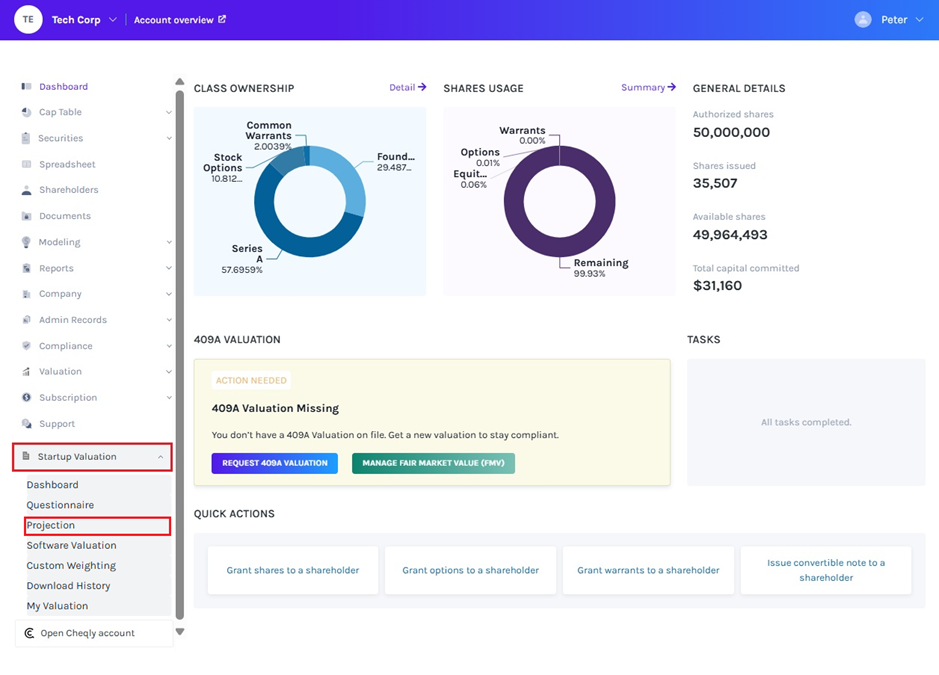
On the dashboard, click on “Startup Valuation” on the left-hand side to get a drop-down menu and click on “Projection”.
Step 2: Then, you will be redirected to the next page where you can begin the process of filling out the projection. You begin by selecting the option:
- Manual: The fields need to be filled manually with the required values to calculate projections.
- Smartfill: Fill in the required information and it automatically calculates the projections.
In this case, we have selected the option “Manual”.
Note: You can also fill the projection manually by clicking “Smartfill”. Check out the support article to learn more about the smartfill option.
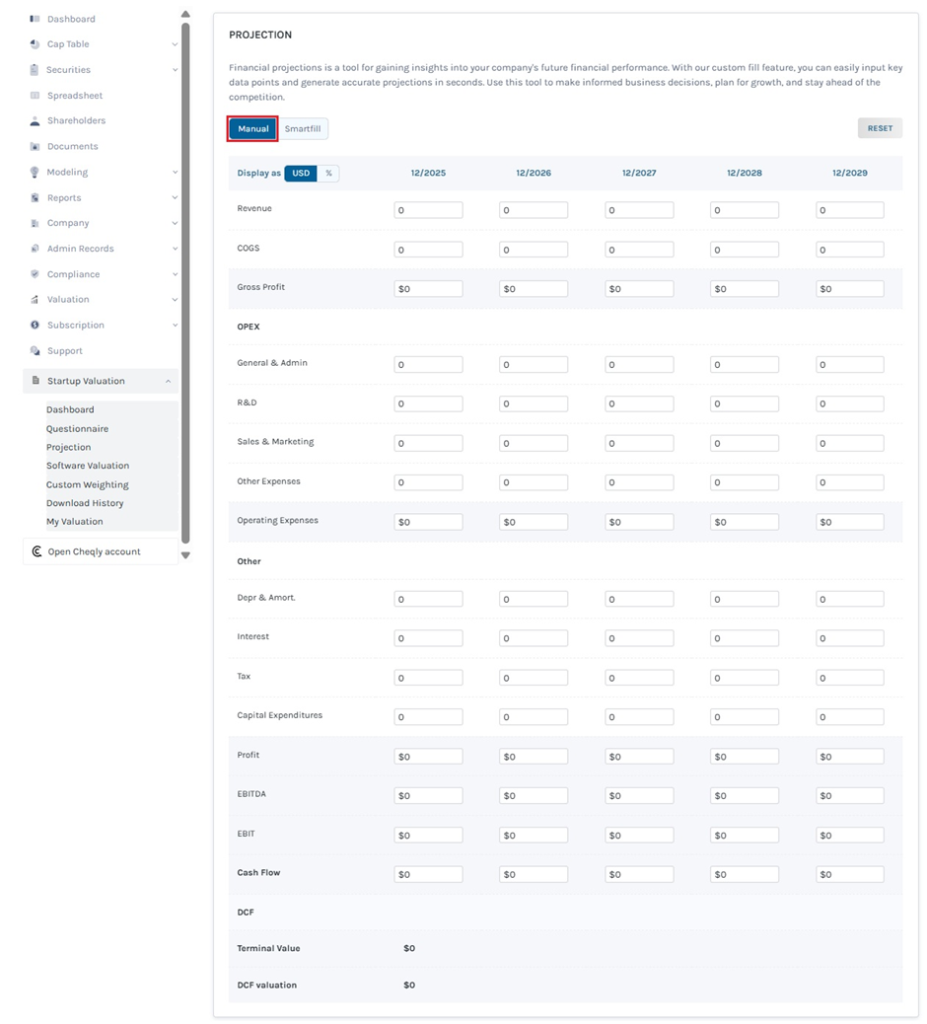
Step 3: After choosing the option, you can begin filling in the details.
Note: The values are displayed in two formats – USD and Percentage.
In this case, we have selected the USD format.
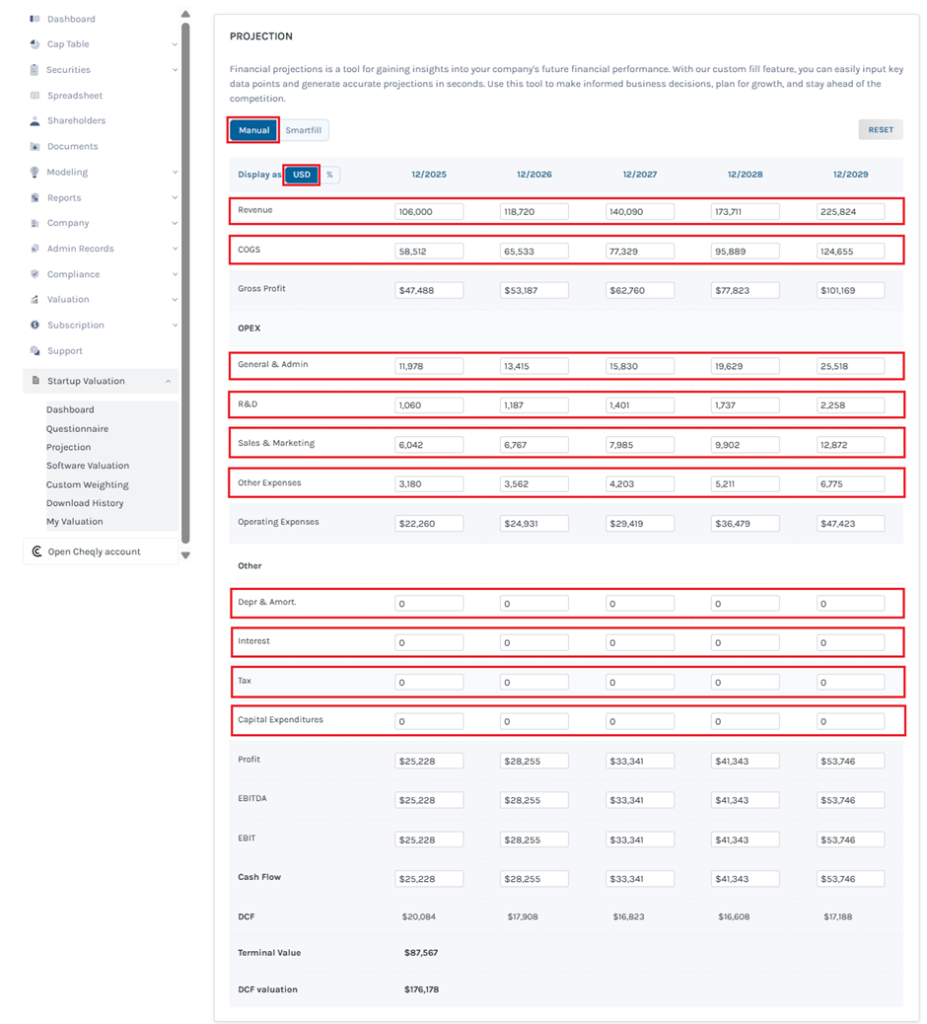
You will need to provide information regarding:
- Revenue: It is the income generated from business operations, determined by multiplying the number of units sold by the average sales price.
Revenue = Number of Units Sold x Average Sales Price
- Cost of Goods Sold: The costs related to the manufacturing goods or services produced by the company. It is calculated by deducting the ending inventory from the total initial inventory and purchase.
Cost of Goods Sold = (Beginning Inventory + Purchase) – Ending Inventory
Operating expenses (opex)
Operating Expense is a cost that a company incurs in running its operations. It is deducted from revenue to calculate profit.
- General & Admin: The expenses are incurred in the daily operations of a business and may not relate to a specific function or department.
- R & D: Research and development (R&D) expenses are associated with the research and development of a company’s goods or services.
- Sales & Marketing: The internal and external expenses incurred related to selling and marketing a company’s product or service.
- Other Expenses: The expenses that do not relate to the business of the company. It includes rent, utilities, wages, salaries, maintenance, depreciation, insurance, tax, etc.
Others
- Depreciation & Amortization: Amortization and Depreciation are methods of calculating the value of assets over time. Depreciation is the expensing of a fixed asset to anticipated deterioration. Amortization is spreading an intangible asset’s cost.
- Interest: An interest expense is the cost incurred for borrowed funds. It represents interest payable on any borrowings—bonds, loans, or convertible debt.
- Tax: The total amount of taxes owed by an individual, organization, or other entity. It is calculated by multiplying taxable income by the tax rate.
- Capital Expenditure: The expense an organization spends to buy, maintain, or improve its fixed assets.
To reset the information entered, click on “Reset”.
However, to see how the data appears on the dashboard’s projection graph, you will have to follow the next step.
Step 4: To see the graphical representation of the projection, click on “Startup Valuation” and from the drop-down menu click on “Dashboard”.
Note: On this page, you will find valuation data and methods breakdown. You can edit the questionnaire by clicking “Edit” on the top right of the projection panel. To further understand the dashboard, check out the support article.
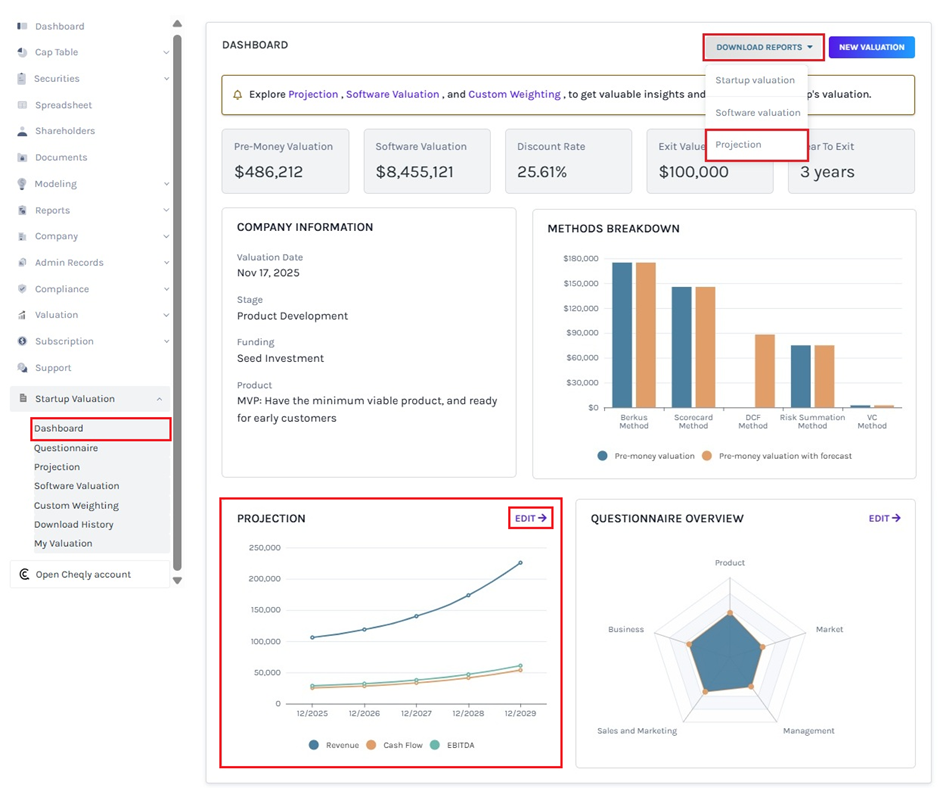
You can download this report by clicking the “Download Report” to get a drop-down menu and click on “Projection”.
Step 5: Once you click “Download”, the valuation report gets downloaded as an Excel in your Downloads.
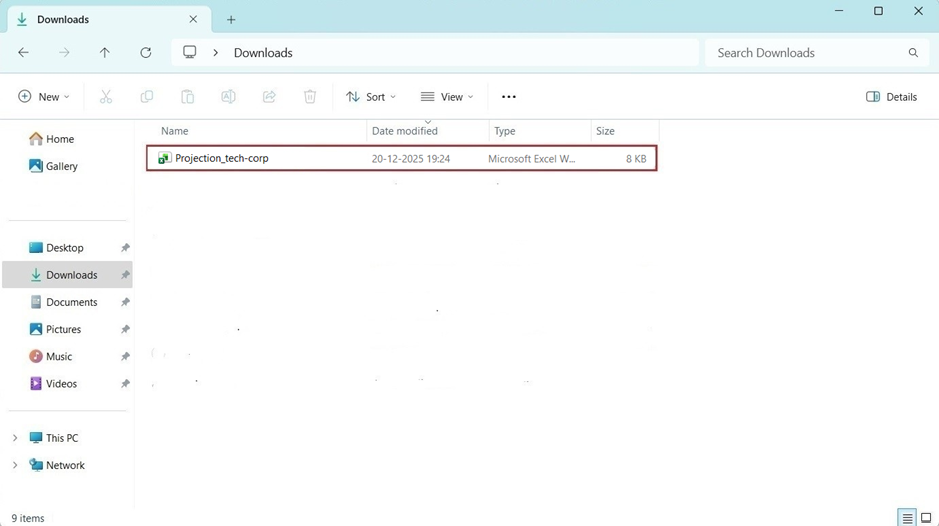
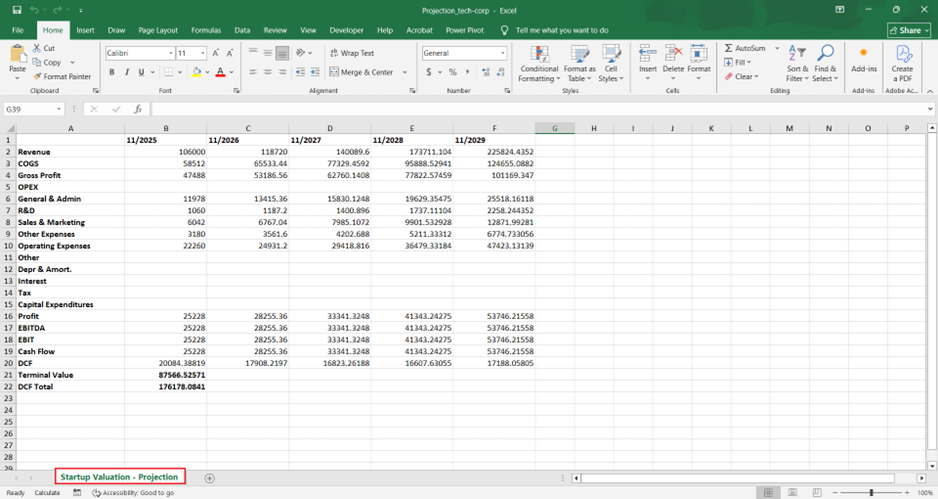
Double-click the Excel file to open the downloaded report.
You can also determine your company’s value by filling out the software valuation and custom weighting. Check out the respective support articles to learn more about this. To know more about Eqvista’s features, check out our support articles and knowledge base. For further queries, get in contact us!
