How to use Round Modeling on Eqvista?
Now you can quickly test different financial scenarios with round modeling before welcoming new investments in your company. Not sure how round modeling can help? Read the support article here to know.
Note: The round modeling feature is only available for premium account holders. Kindly upgrade your account to unlock this feature.
Round Modeling
In this article, we will take the next step and elaborate on how to use the round modeling tool on Eqvista. Let’s get started.
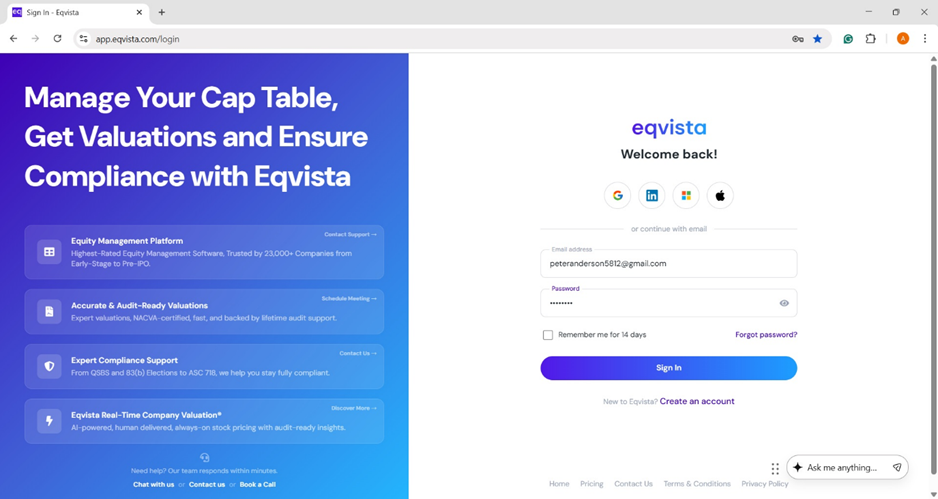
Step 1: Log into your account on Eqvista and select your company’s profile.
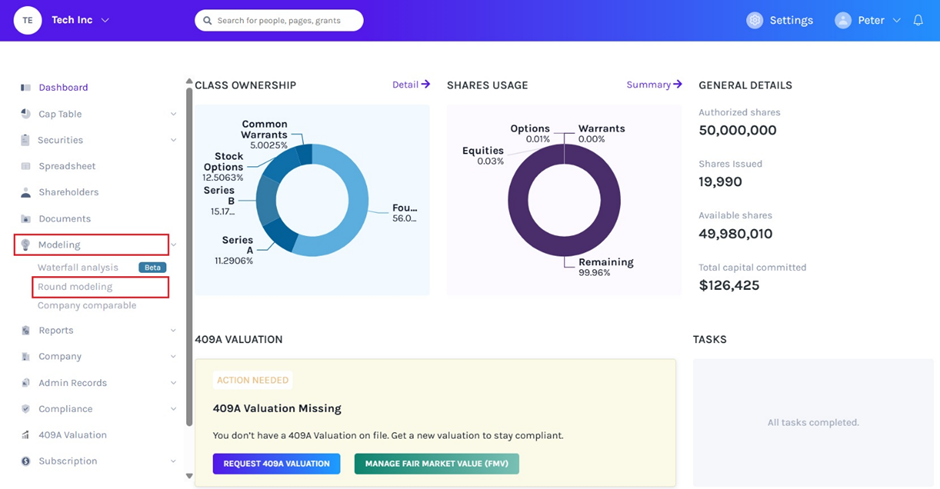
Go to the ‘Round modeling’ tab under the ‘Modeling’ menu on the left panel.
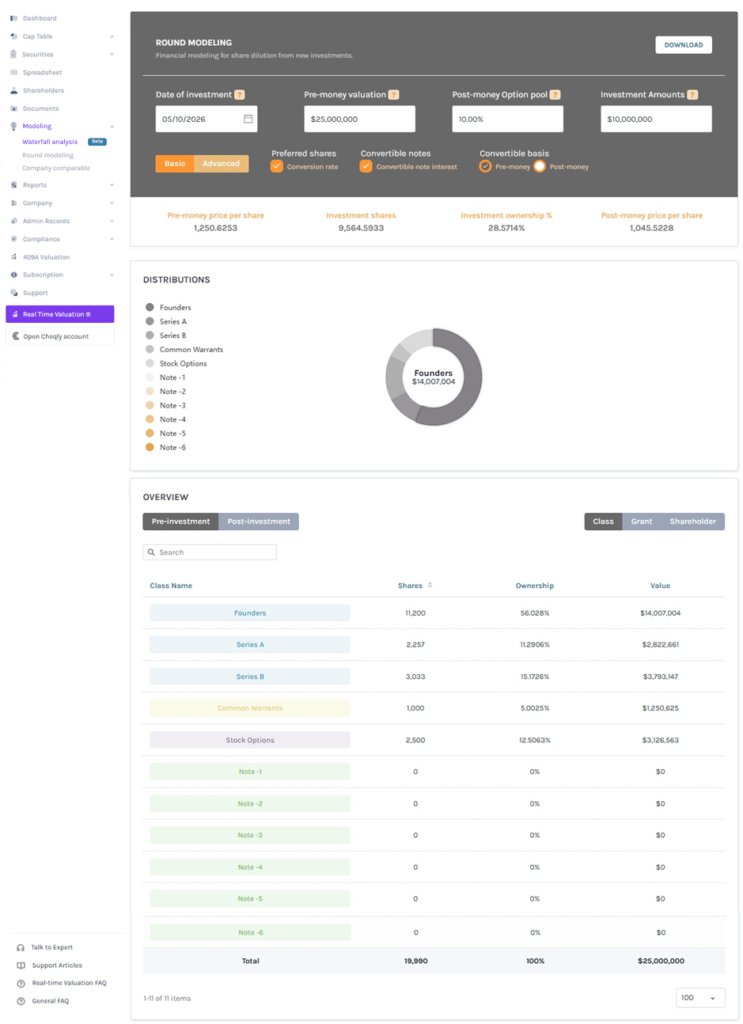
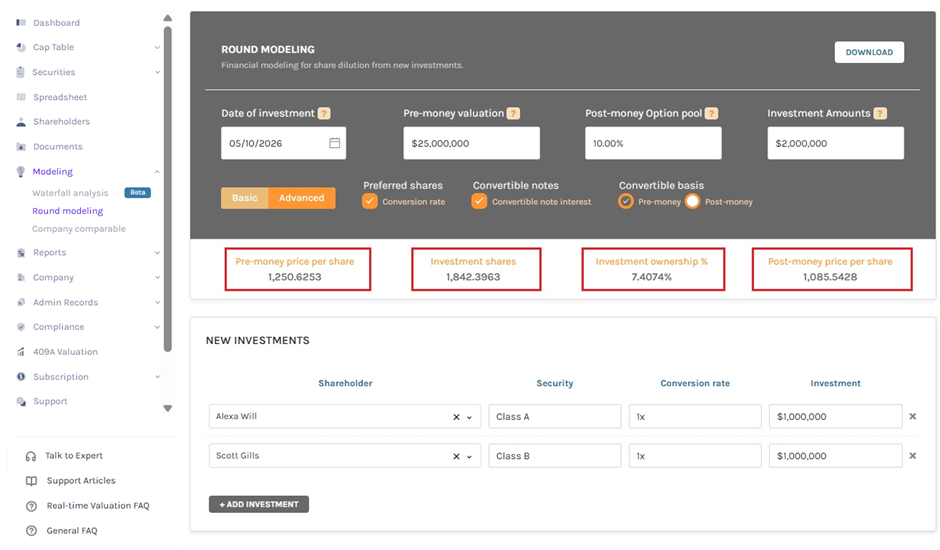
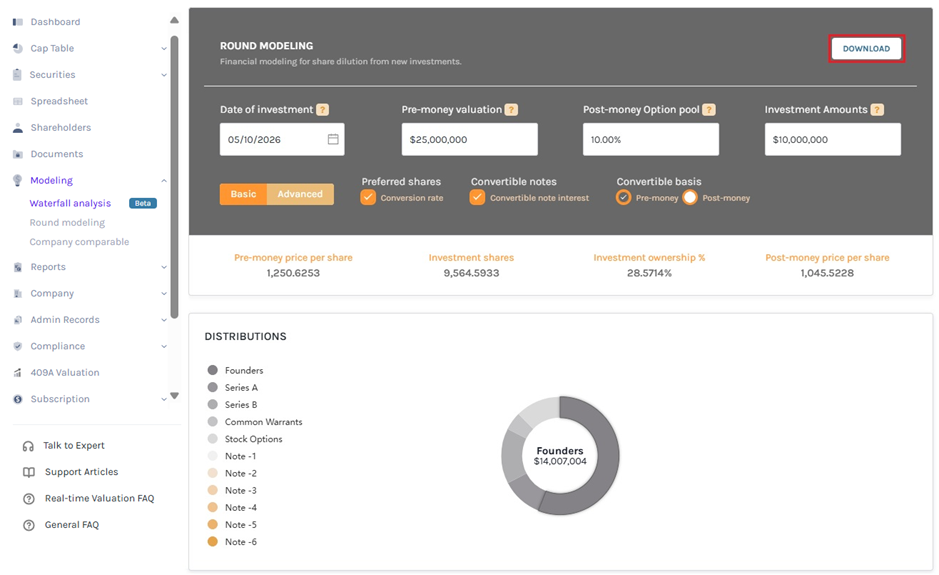
Step 2: This will take you to the ‘ROUND MODELING’ page as shown below.
Step 3: The top has 4 fields for your input. You can customize different financial scenarios for round modeling by entering different values in these fields.
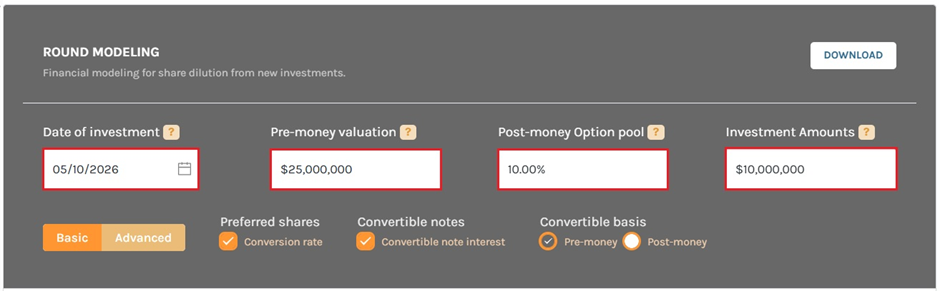
The data you will need:
- Date of Investment: The date of the new investment for which you want to create the model.
- Pre-money valuation: The value of your company before the new investment.
- Post-money Option pool: The percentage value of the new option pool created.
- Investment amount: The amount of the new investment.
Just below the fields where you have entered the data, you have three more options to customize your round model. Let’s find out how these options will impact your model.
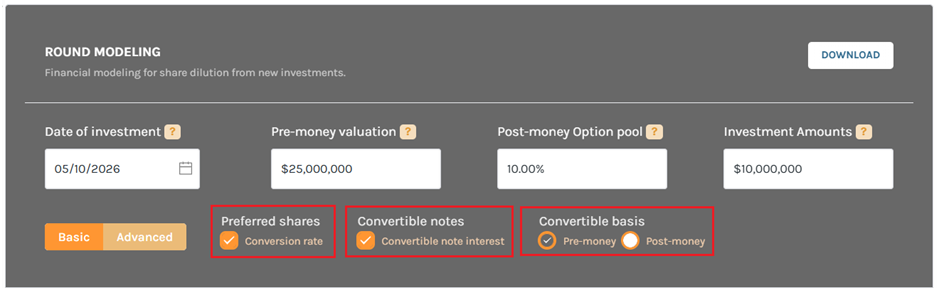
- Preferred shares: You may include or exclude ‘Conversion rate’ on preferred shares in this calculation from this field. It will be set to ‘include’ by default. You can uncheck the box if you want.
- Convertible notes: Keeping this field checked will include the interests earned on the convertible notes in the modeling. Uncheck it to ignore the interest.
- Convertible basis: This field comes with two options – ‘Pre-money’ and ‘Post-money’. Selecting ‘Pre-money’ (which is also the default option) will show conversion of notes before the new investment. Selecting ‘Post-money’ will display conversion of notes after the new investment. ‘Pre-money’ is selected by default.
Step 4: Once you have provided all the inputs in the respective fields and selected the right options according to your modeling scenario, you can either opt for – A. Basic or B. Advanced round modeling from the left orange button. By default, it is set to ‘Basic’.
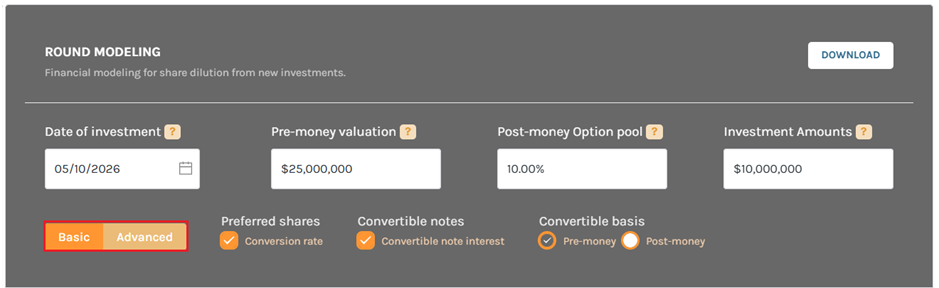
A. Basic
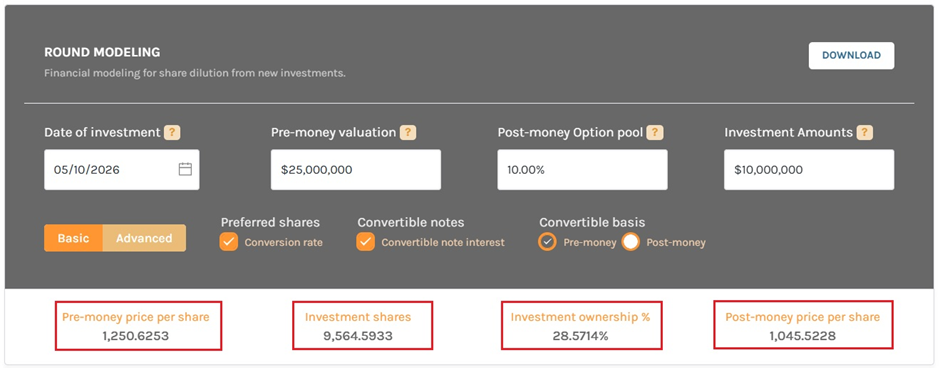
If you are considering a single ‘New investment’, select ‘Basic’. You will find the values for Pre-money price per share, volume of Investment shares, Percentage of Investment ownership and the post-money price per share for this scenario all displayed just below the grey box.
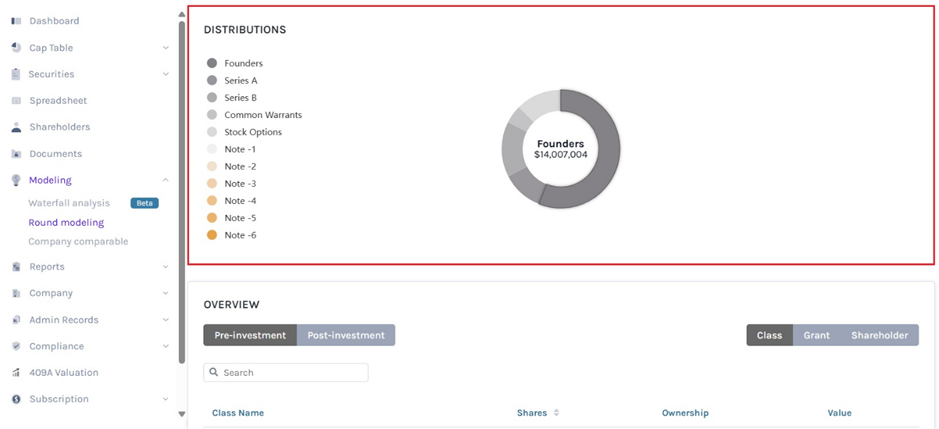
The next section of the page will show security distributions in a list and a pie chart for ease of understanding and presentation. Each security type on the list is colour-coded, and hovering your cursor over any security type on the list will display it in the pie chart.
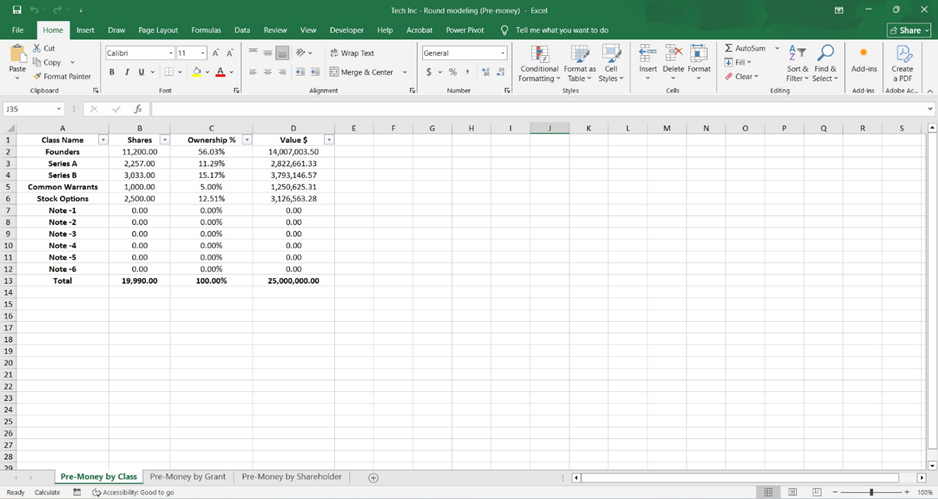
Now, coming to the last section of the page, you will see a table summarizing the ‘Pre-Investment’ picture of the company’s share classes. It should be identical to the cap table of the company.
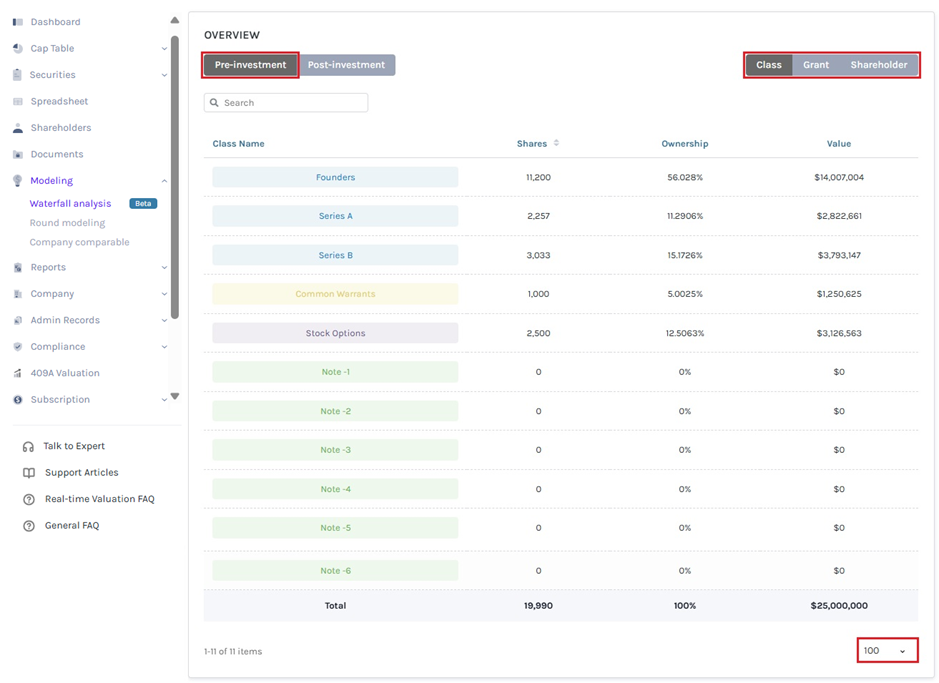
At the bottom of the page, it also displays the options to select from drop-down menu the number of transactions to be displayed on the page.
The Overview table can be viewed in three different ways by clicking on:
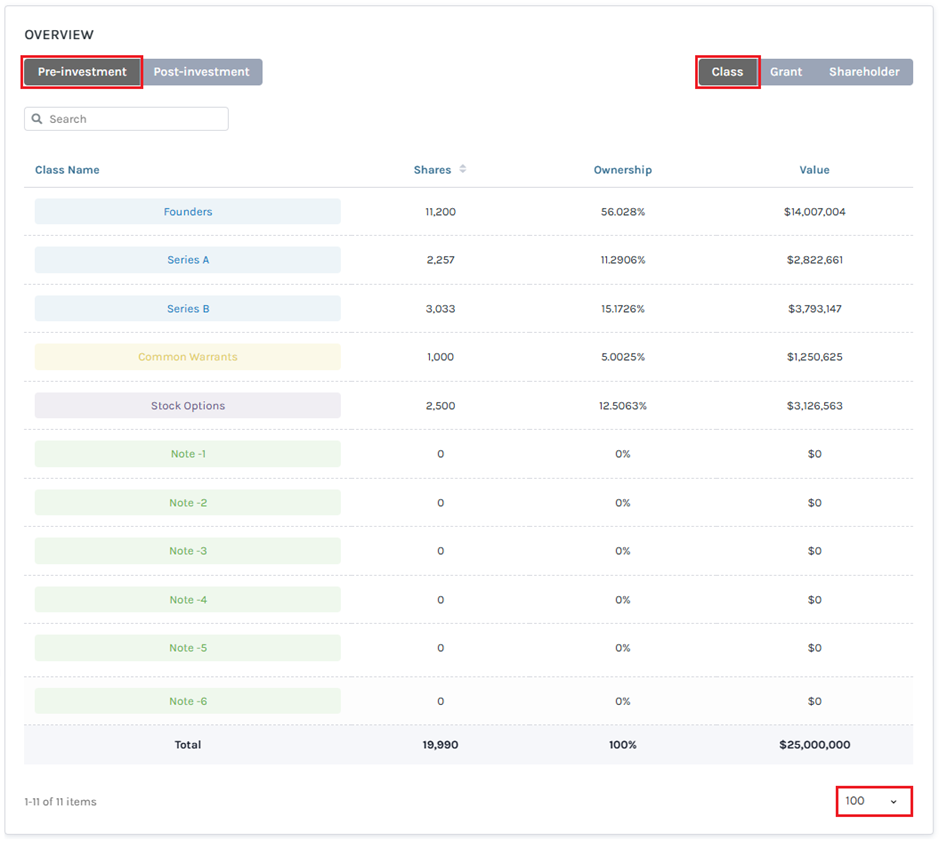
#1 Class
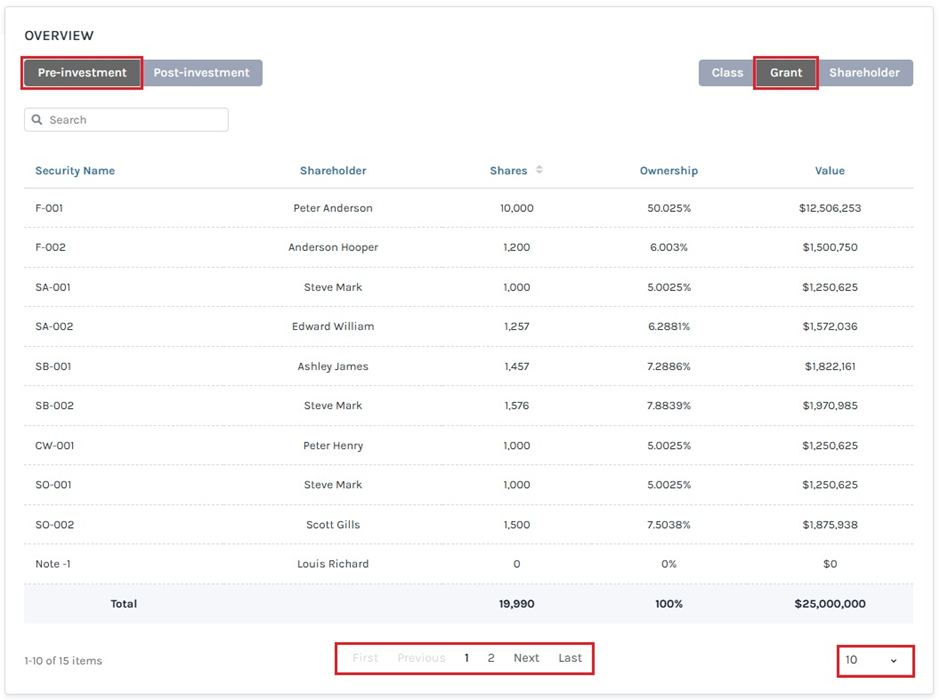
#2 Grant
To view the next pages, scroll down and click on the next page number. It also displays the options to select from drop-down menu the number of transactions to be displayed on the page.
#3 Shareholder
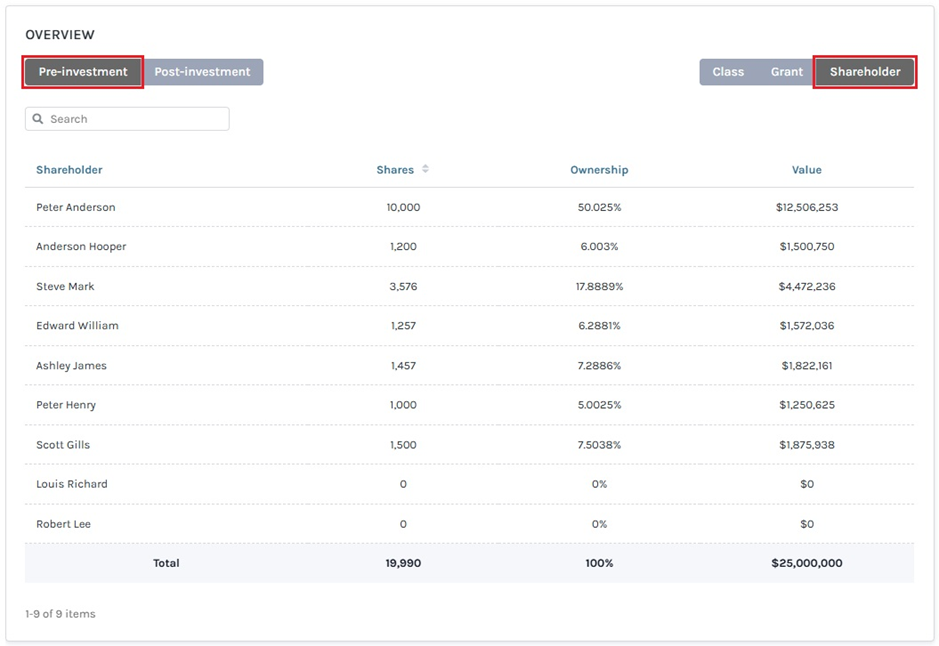
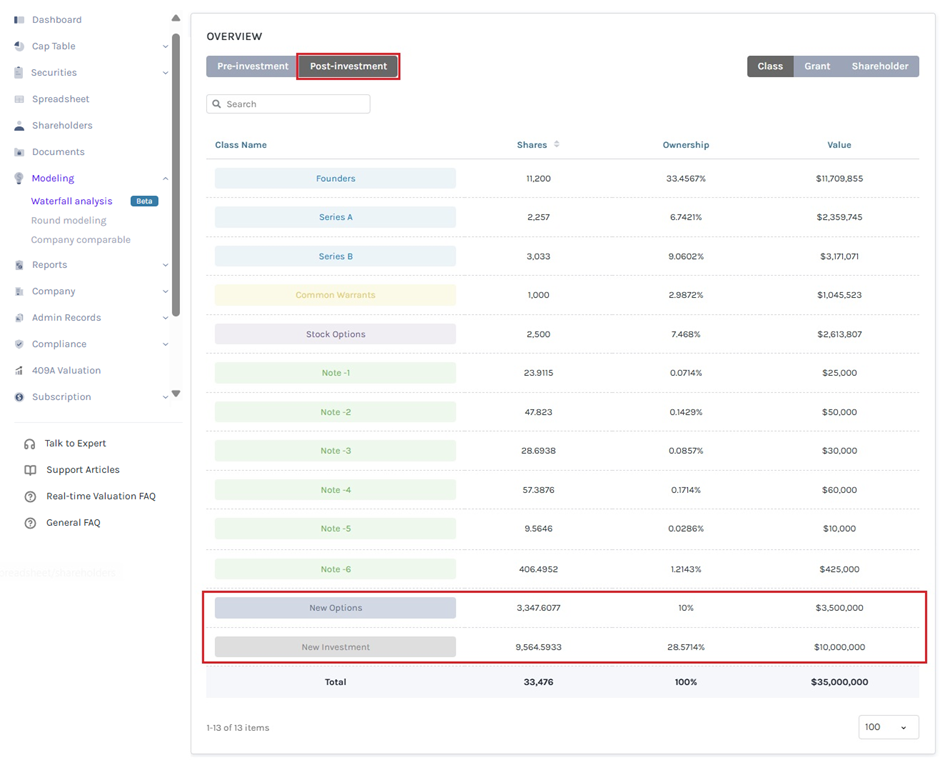
You can change the table to ‘Post-Investment’ from the button at the top left. Once you select ‘Post-Investment’ all the post-money values, including new investment and option pool will be displayed in the table. This will show the total effect of dilution on the company’s cap table.
B. Advanced
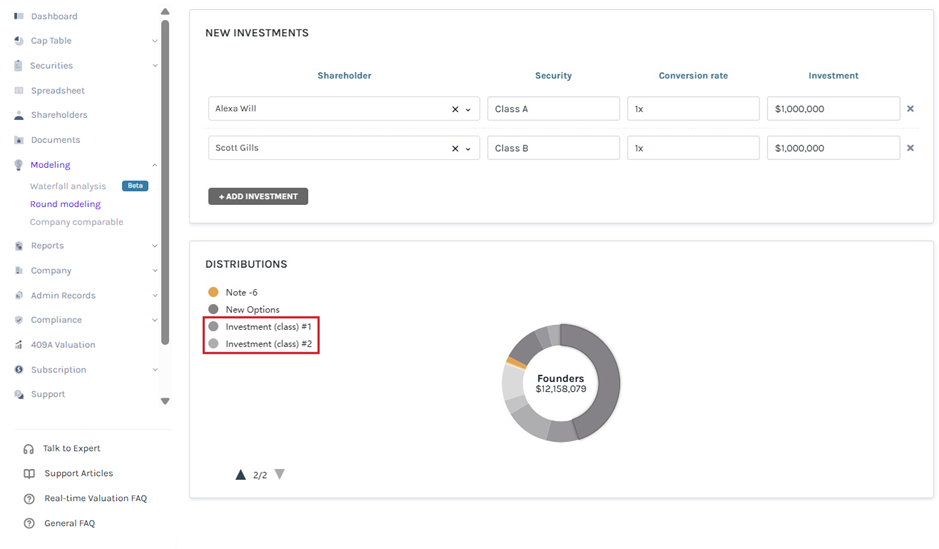
The ‘Advanced’ button gives you the flexibility to add investments from multiple shareholders to the modeling. On clicking ‘Advanced’, the short window for adding shareholders (as shown above) will open. Fill in the respective fields with the Name of the Shareholder, Type of security, Conversion rate, and amount of investment in USD. To add more investors, just click the ‘+ Add Investment’ button at the end and a new field will be added as shown next.
As you add the different shareholders with their respective details, you will see that the values for Investment shares, Investment ownership %, and Post-money price per share as displayed above will keep on updating. Similarly, the new Securities will be added to the list and pie chart below the table.
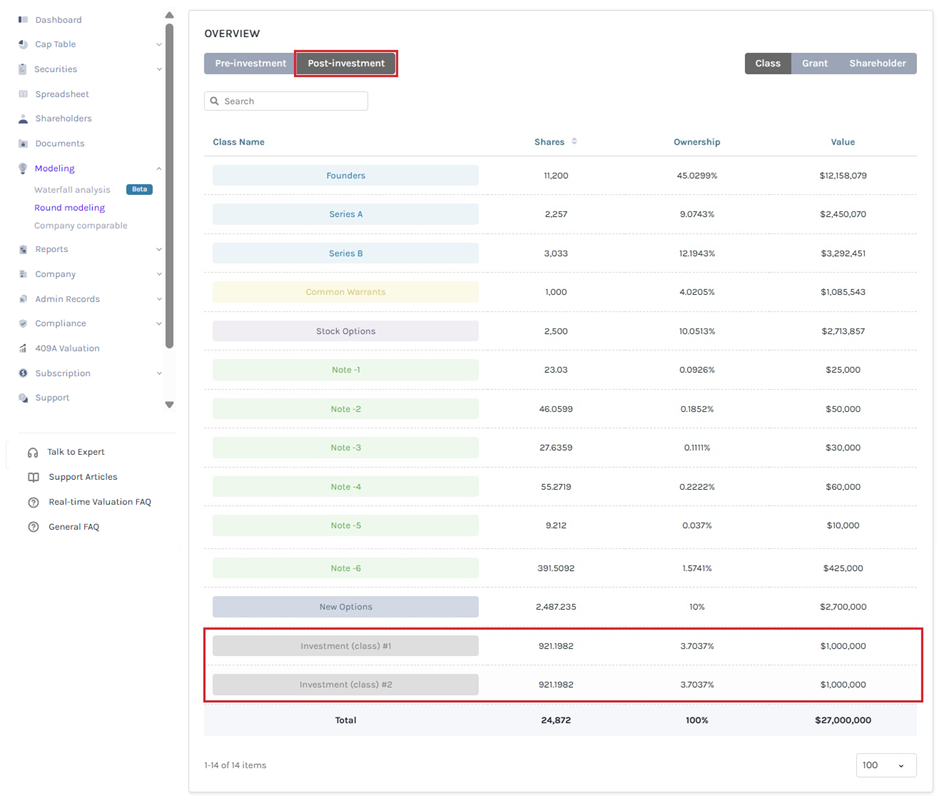
Simultaneously, the new securities will also be added to the ‘OVERVIEW’ table at the end of the page, and you can see by clicking ‘Post-investment’.
Step 5: Now that you have completed round modeling for the scenario, you can download it from the ‘DOWNLOAD’ button at the top right corner of the page.
Step 6: By clicking on this, your download will begin and the modeling will be saved in the form of an Excel sheet in your system. In this case, the modeling has been saved in the Downloads.
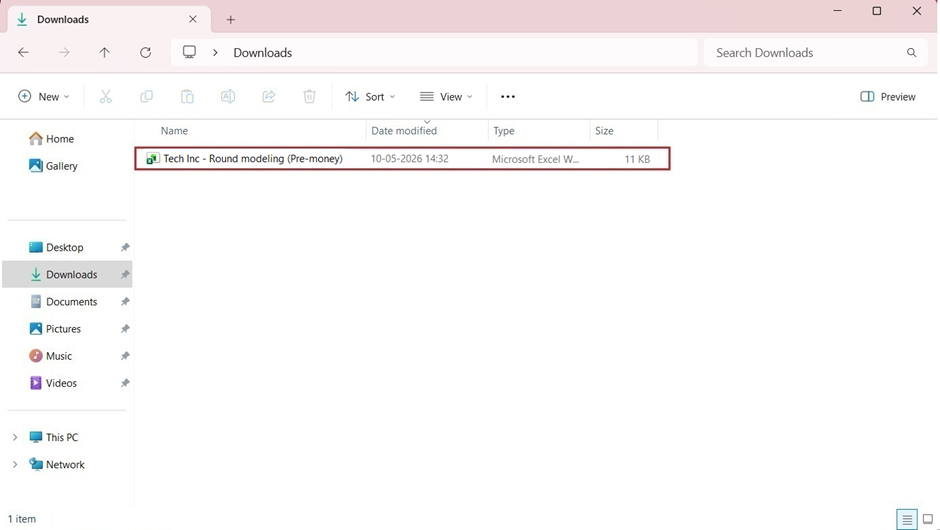
Double-click the Excel file to open the modeling.
Round modeling will assist you in calculating the cap table dilution due to new investments and is most useful for companies with complicated cap tables, or for those who would like to consider different new investment scenarios. If you want to know more, feel free to get in touch with our team.
